

When analysing the performance of your retail business, you no doubt need to consider your retail data. It’s especially vital to do that if you have invested in category management. That’s because effective category management begins with vigorous data analysis. Of course, reporting on your entire database at once isn’t advisable. That’s why there are data cubes.

What are data cubes?
A data cube is a multi-dimensional array of values used to understand data that is too complex to be understood or interpreted by a table of columns. That’s the technical description if you were to look it up.
In layman’s terms, though, it’s straightforward: a data cube stores a smaller aggregated subset of data from your database for easier handling.
In the context of retail and DotActiv, a typical data cube consists of four dimensions, namely Market, Product, Period, and Fact. You can break these dimensions further down into sections or groupings and filter them depending on your requirements.
For example, you could analyse figures for any or all of your store types, your clusters if you have set them up, and even your hierarchy levels.
As for its importance, reading the above should be enough of an argument to explain why you need to use data cubes. Referencing data cubes instead of your entire database makes sense because it’s faster and more efficient. It enables you to spot trends in your data and act on them accordingly.
Here’s another reason: a data cube plays a vital role in reporting as it allows you to create a custom report that you can use to analyse your performance.
How do you build a data cube in DotActiv?
As already noted, a data cube contains a small subset of data on which you can build your custom reporting.
But how do you go about setting up a data cube in DotActiv? Below, we unpack the process.
After opening DotActiv, navigate to File and then Setup. In a dropdown menu that pops up, you can scroll to the Database section where you can find Data Cube. As seen in the below GIF, clicking on it brings up the Data Cube setup window.
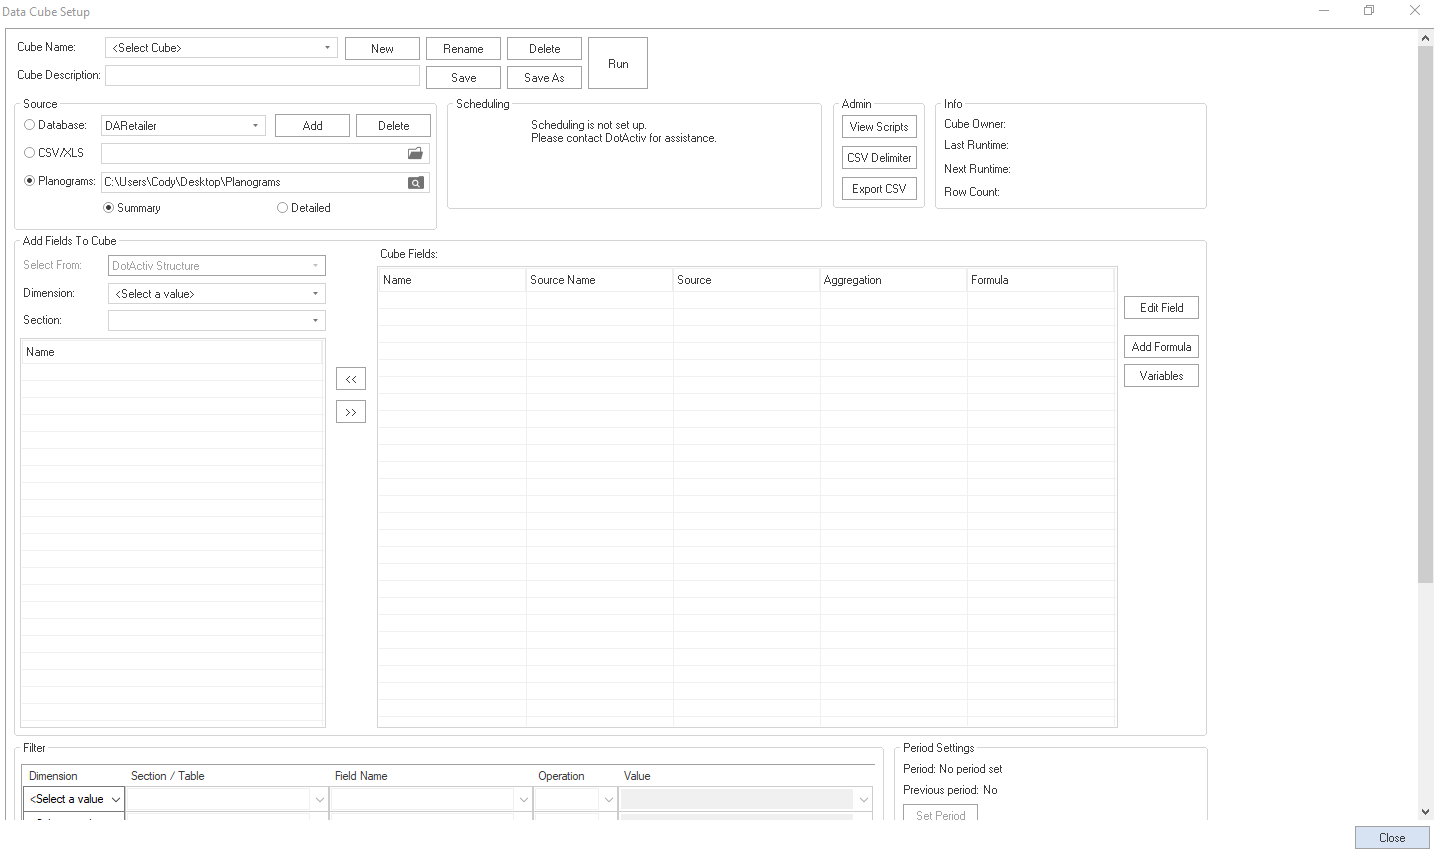 Data Cube Setup Window in DotActiv
You can begin by choosing to create a new data cube or select one that you set up previously. Clicking on the Cube Name section brings up all the cubes that you or your colleagues have already created.
Let’s set up a new cube.
To do that, click on New and enter a name. You can also enter a description for your cube if you wish.
From here, you need to select a source. As you can see in the GIF, you have a few options. You can choose to connect to a planogram, a CSV/XLS file or a database. For this example, we’ll choose the database. If you want to change the database, you can click on the name and select a different one.
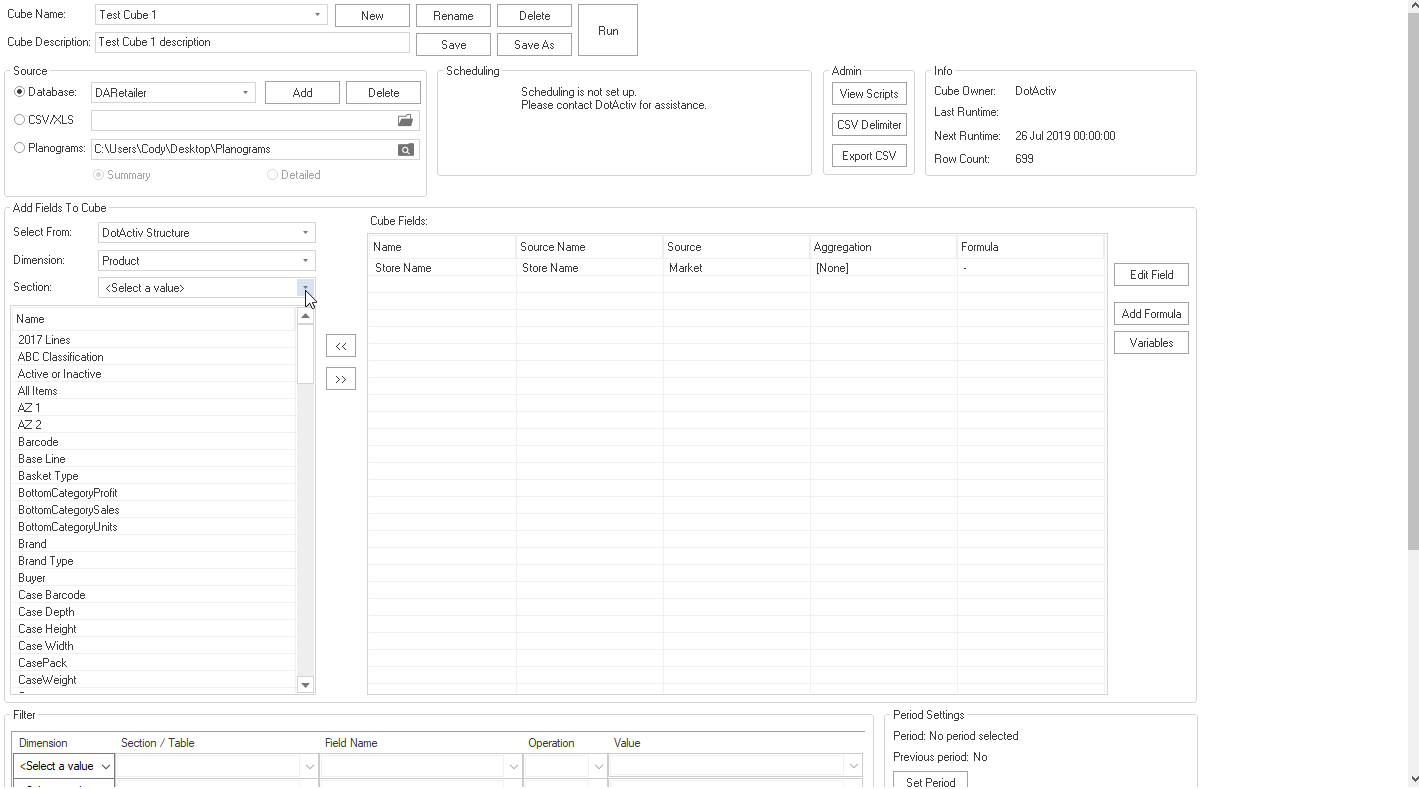
Adding Product fields to the Data Cube in DotActiv
Next up, it’s time to select the fields that you want to add to your data cube. Please note; it’s advisable that you know what you want to report on before you choose your fields. The last thing you’d want to do is select either the wrong fields or ones that you don’t need for your report.
For this example, we’ll add all the relevant Market, Product and Fact information to our data cube, all found under the DotActiv structure.
After selecting the Market dimension, select Store Detail from the Section dropdown menu and begin adding your fields. For Store Detail, that includes your Store Name.
Next up is the Product dimension, which has two parts. In the section dropdown menu, we’ll first select Retailer Hierarchy after which you can begin adding your various levels such as Merchandising Group, Department, Category and Sub-Category and Segment.
Following that, we’ll select Item Detail and add Product Code, Barcode, Brand, Product Description, and Size & UOM. As you’ll notice, after clicking on any field to add, a pop up window gives you the option to edit it.
For the Fact dimension, we’ll first select the Retail section and then Sales at Sell and Sales Quantity. Lastly, there is the Period dimension where you can add a To Date and From Date.
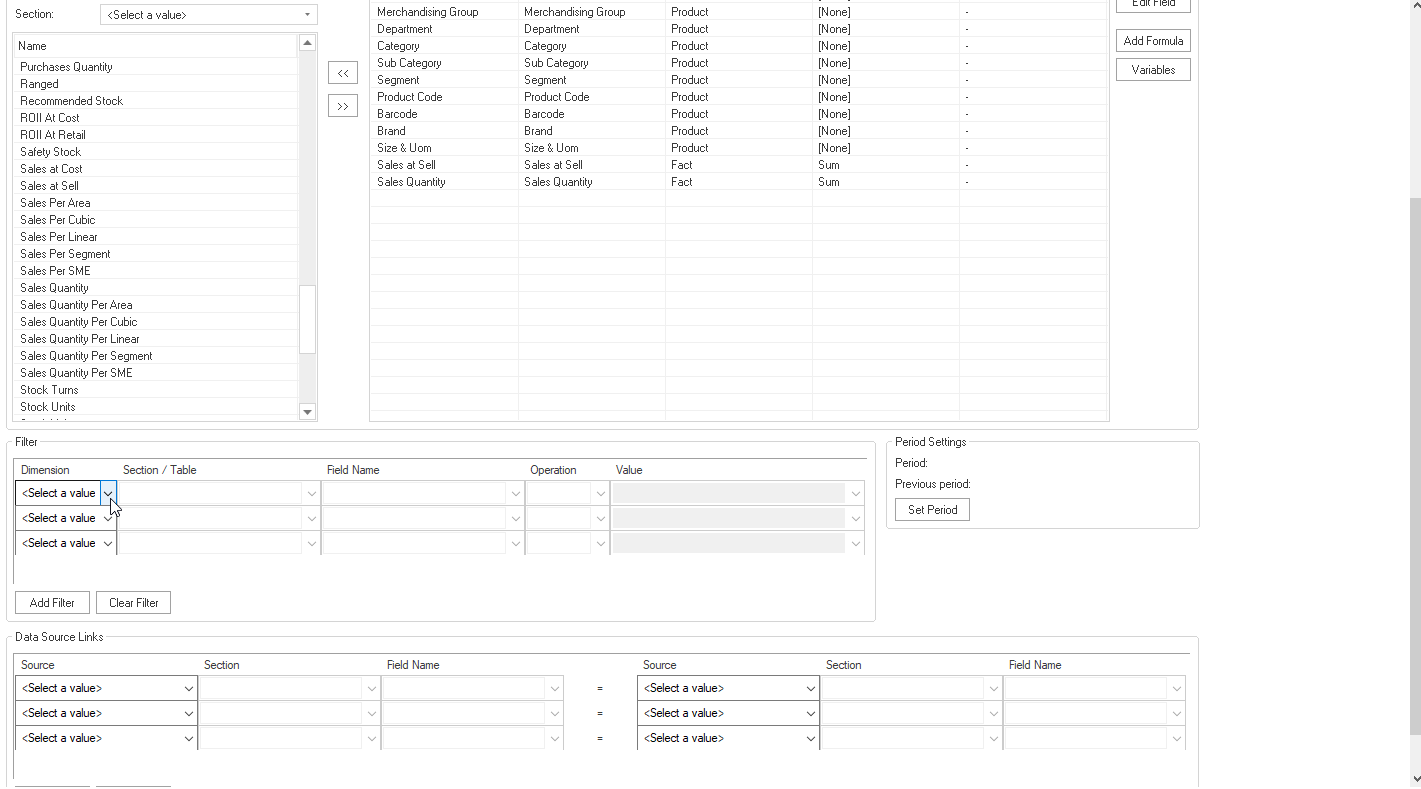
Using the filter function when building Data Cubes in DotActiv
The next step is to use the filter function at the bottom of the Data Cube setup window. Why? Because filtering will allow you to specify what you want in your cube.
And if you don’t? Let’s say you don’t filter your Market dimension - in this case, it’s your Store name. That means the cube will pull all the store names on your database, thereby slowing down the process. It also makes you be less efficient if you only want to report on one store.
Let’s go ahead and choose our Market dimension. We’ll add Store Detail and select the name of the store we want to include in the report under Value. We’ll also filter by Equal under the Operation field.
Next, we’ll include the Product dimension. For the sake of this example, we only want to report on the Baby Foods category, so we’ll choose Retailer Hierarchy and Category. Under the Value field, we’ll search for and select Baby Foods. Again, if we don’t include this filter, our cube will pull the information for all categories found at the Corlett Drive store.
Finally, we must select a Period. The Period Settings window pops up where you can click Set Period.
You have the option to use the last three periods or you can manually select your period. If you want to exclude the latest period, you can do so too. You might want to exclude the last period when you pull a report halfway through a month and don’t have all the information. You can also select prior periods to track growth.
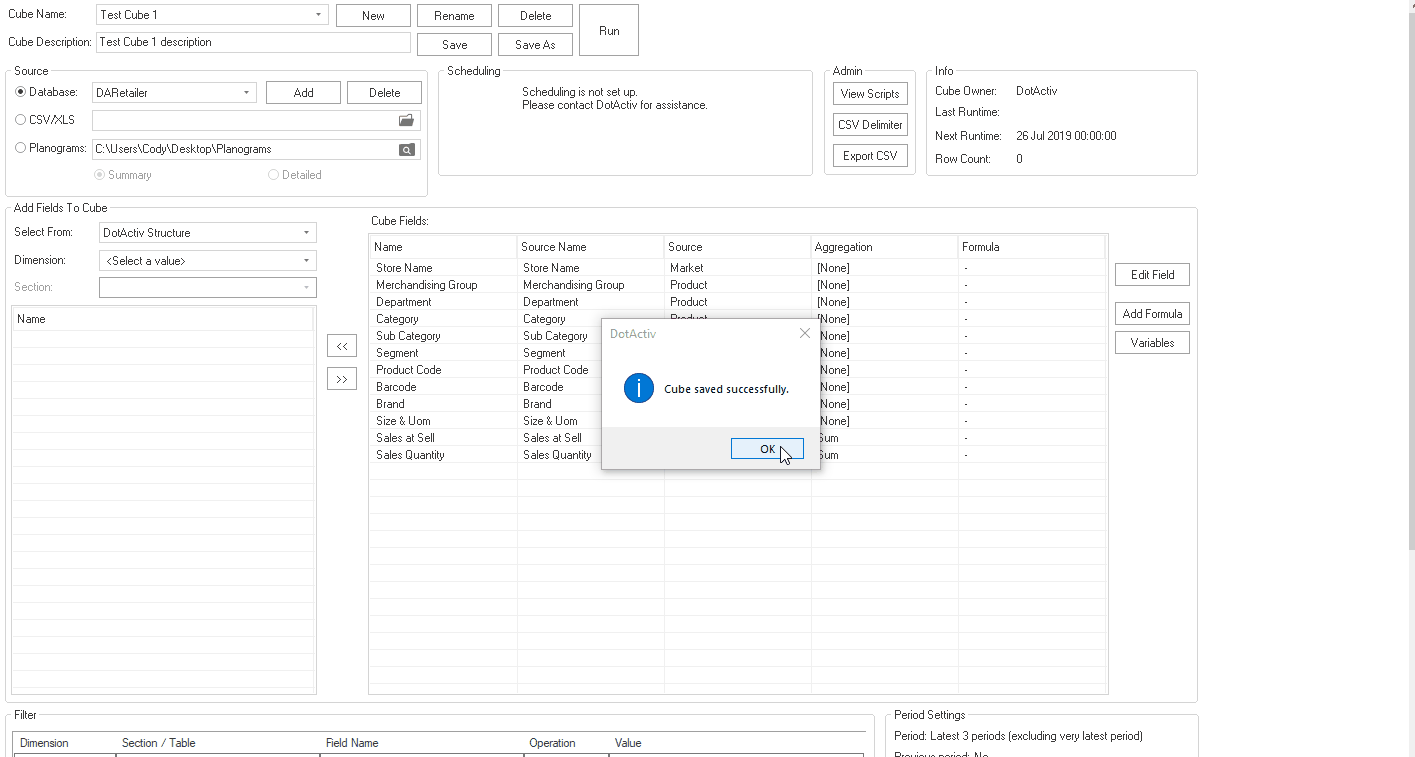
Saving and Running a Data Cube in DotActiv
Once done, all you need to do is save your data cube. It’s crucial to note that we might have saved your cube, we haven’t run it yet. That means we haven’t yet populated the cube with data. Clicking on Run and choose when you want your cube to run. You can choose to run it immediately or at a later date, depending on your requirements.
Also, once you’ve run the cube, click save again.
And there you have it. You now know how to build and run a data cube in DotActiv. From here, you can begin building a custom report and report on your retail data.
Conclusion
DotActiv Lite, Pro, and Enterprise are all different versions of our category management software that allows you to drive category performance. All three editions come standard with access the Standard Planogram Reporting Functions. You can visit our online store here and try our any edition of our software for free, for 14 days.
