
RETAIL DATA
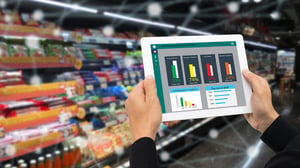
Retail data refers to any facts or figures that retailers can collect about their business, which they can use to improve it.
It comes in many different shapes and forms, including point of sales data, loyalty card data, and market data.
WHY IS RETAIL DATA IMPORTANT?
Considering the power that your customers have today - they can decide your store’s fate by choosing to either buy your products or not - you must remain a step ahead of them.
That is why retail data is so important. It gives you the information that you need to compete and compete well.
COMMON DATA AND SPACE PLANNING TERMS


Want to get started with Retail Analytics?
Get a detailed introduction to data and practical tips on how you can begin with
retail analytics in this free ebook.

DATA TRANSFER METHODS

The transfer of data is, as PC Mac describes it, the “copying [of] data from one computer to another. When a network is used, data are technically ‘transmitted’ over the network, rather than transferred; however, the terms transfer and transmit are used synonymously”.
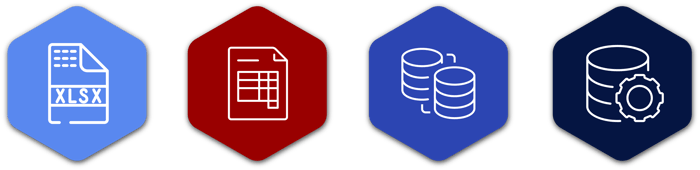
When the time comes to transfer data, you have several options available to you. Below are two examples:
Transact-SQL: Transact-SQL is Microsoft and Sybase’s extension of SQL, and you can use it to send data between relational databases. This method requires the ability to write SQL scripts or queries using Transact-SQL.
DotActiv Data Import Utility: DotActiv has a dedicated application that imports data from SQL staging tables into the DotActiv data platform. Once set up, you can schedule the import utility to run its imports at whatever time you choose. The data import utility can run automatically.
DATA SOURCES
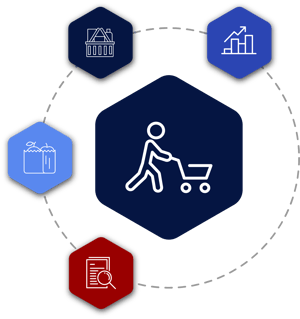
WHAT ARE DATA SOURCES?
A data source is primarily a location from which you can use data. Better put, it is a collection of records that store data that you can use in the future or when needed.
Concerning a retail business, that could be any data related to the products you sell in your store, any data on the number of sales you make, or on your overall stock.
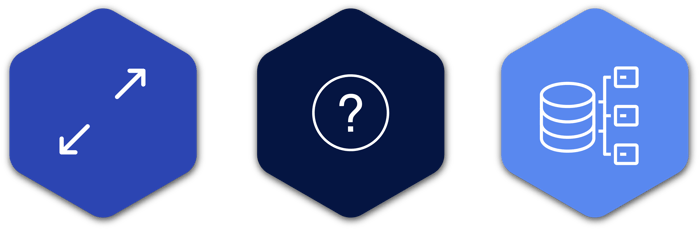
From a simple file to a complex database on a database management system to a live data feed, data sources take various forms. As for where data is stored, there are only two instances. You would either store data on the same computer as the program you are trying to access. Or, you would store it on a different computer on your network.
POINT OF SALE DATA

LOYALTY CARD DATA
WHAT IS LOYALTY CARD DATA?
Loyalty cards, and the customer data you can collect from them, can influence how you run your business. That is because it will allow you to know your shopper. And with this type of retail analytics data at your disposal, you can only expect to profit.
Similar to POS data, there is also power in loyalty card data. It can tell you the reasons why your shoppers are coming back to your store. It can also tell you how much your shoppers are spending on average per trip.
More than that, though, is what you can do with this data. And that is where its true power lies.
To make full use of the data you collect from your loyalty cards, you need to plug it back into your business. One way of doing that is to use it to build your ranging strategies.

RETAIL ANALYTICS

THE DIFFERENT TYPES OF RETAIL ANALYTICS

With the correct type of data, your business has the power to gain a competitive edge. To ensure that happens, you have to have more than just the necessary data. You also need to understand the different types so you can leverage the data.
There are four different types of data, namely Descriptive, Diagnostic, Predictive, and Prescriptive. And each of them answers a question, which helps your business to move forward.
GET STRATEGIC CATEGORY MANAGEMENT ADVICE UNIQUE TO YOUR BUSINESS
With DotActiv’s retail advisory services, if you’re a retailer, you can get strategic category management advice that helps you to improve your business.
If you’re a supplier, this advice can help you improve your product exposure through increase shelf space allocations.
We can also help you to create or crystallise your short, medium and long-term category management vision.

WANT TO LEARN MORE ABOUT RETAIL ANALYTICS?
![]()
In this ebook, we cover Descriptive, Diagnostic, Predictive and Prescriptive Analytics.
We also provide a detailed introduction to data and practical tips on how you can begin with retail analytics.