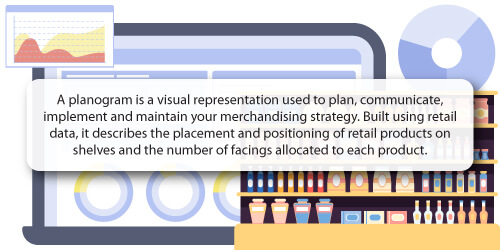
Planograms form a critical part of any category management effort. They're what you implement in-store to help you increase your sales. Of course, it's not just the planogram that enables you to realise your goals and objectives. It's also all the data within it and the features and functions around it that make it more effective. One such example is DotActiv's Planogram Highlights function.
It's a function accessible to all DotActiv software users, regardless if you're only getting started with category management and only need planograms (we recommend DotActiv Lite) or have extensive experience and require an all-in-one category management software solution (we recommend DotActiv Enterprise).
It’s also a function, along with others, that our category management experts use when delivering our professional services. But what does it all entail? We unpack it all below.

What is DotActiv's Planogram Highlights function?
DotActiv software includes various planogram features and functions that enable you to build data-driven shelf plans to increase sales and please your customers.
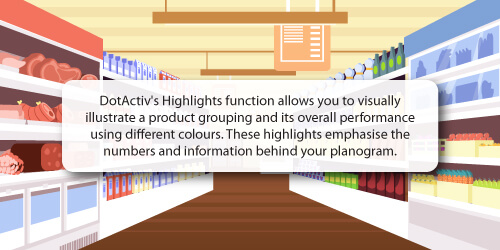
DotActiv software provides a wide range of highlighting functions depending on what you want to emphasise.
You can highlight according to:
- Brand;
- Sub-category;
- Segment;
- Sales;
- Units;
- Product Description; and
- Days of Supply (DOS).
Let's take the example of the Days of Supply (DOS) highlight.
When delivering our category management services, our category and space planners use this highlight to illustrate how they have maximised the space allocation by considering the number of days it takes for an individual product to run out of stock.
Using the DOS highlight also provides you with many benefits.
1. You can determine which products run out of stock first
The DOS highlight leads to improved inventory management as you can specify how much stock should be available, as well as when you should order new stock.
2. You can determine which products require more or fewer facings
Combined with your sales and unit contribution, you can determine which products require more or fewer facings on the shelf.
It gives you a competitive advantage because you can provide the right product assortments to your customers, which ultimately creates a more enjoyable shopping experience for them.
3. You can determine your top-performing products
Together with other datasets, your DOS can indicate your top-performing products. Understanding which products are your top performers enables you to make strategic business decisions.

How do you use DotActiv's Planogram Highlights function?
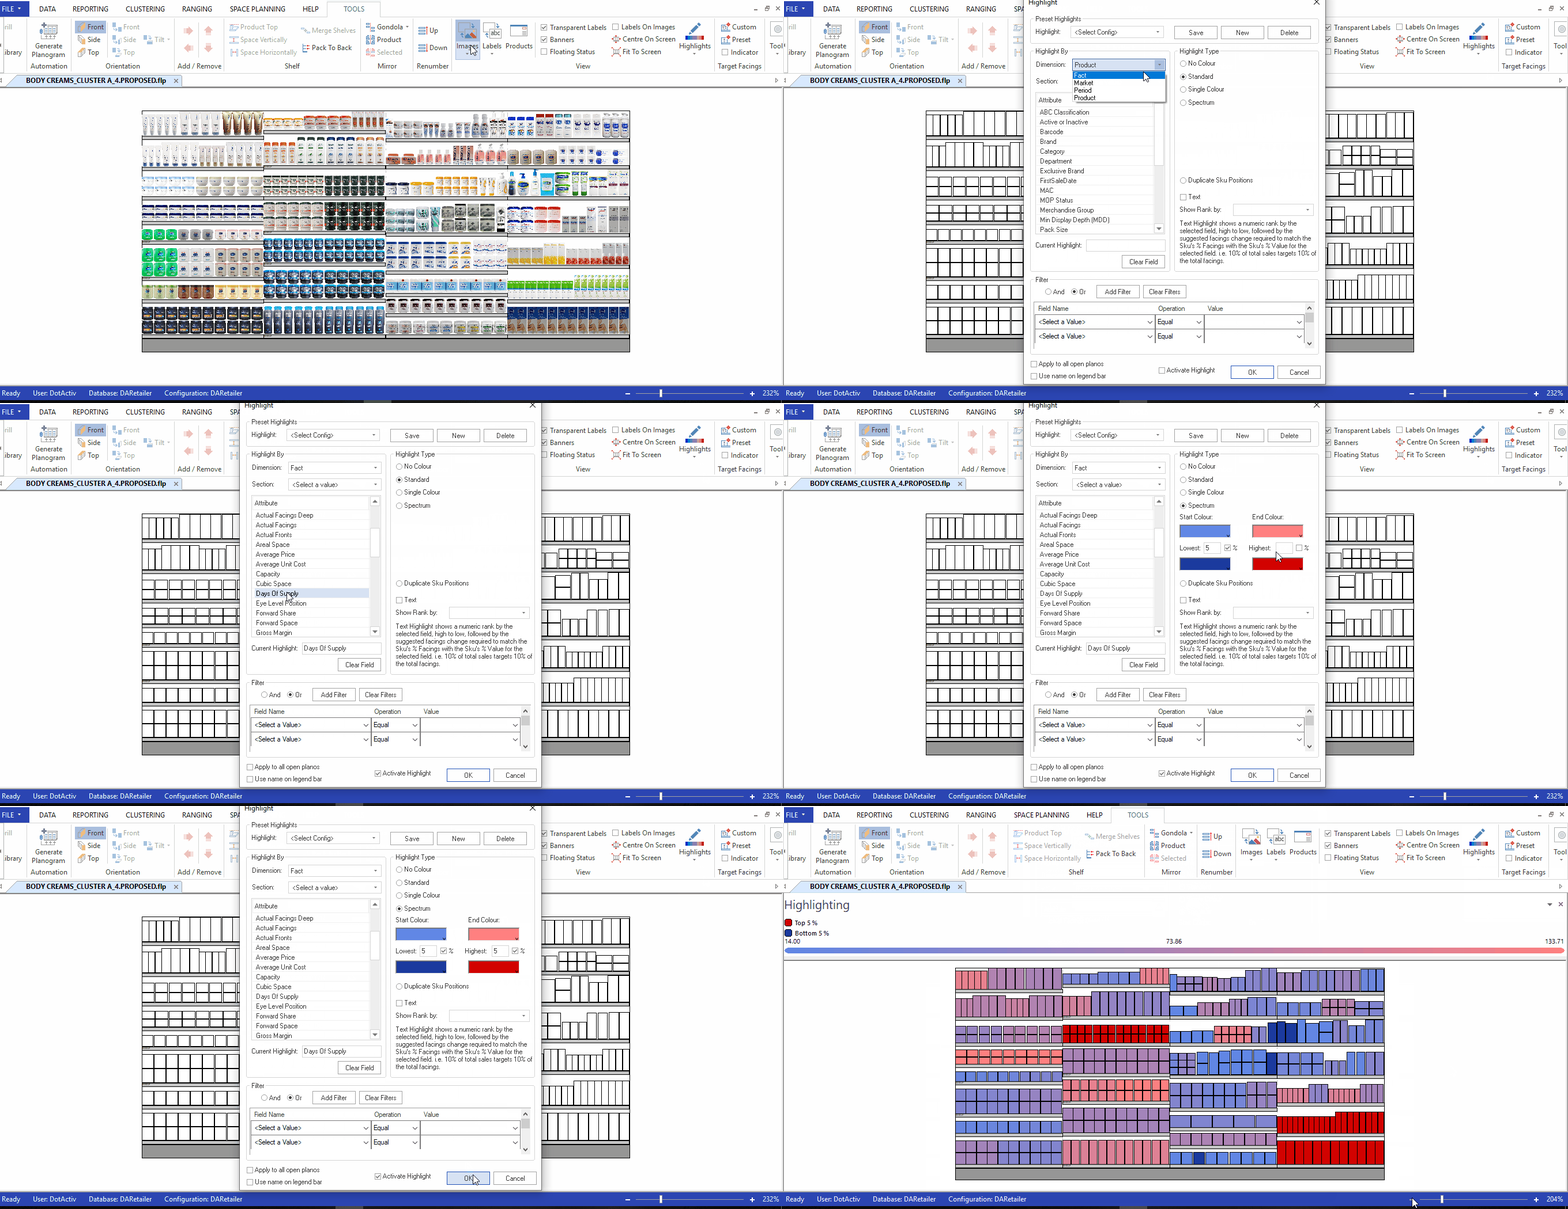
Once you open a planogram in DotActiv, you can find the Highlights Function button under the shelf planning tools tab in the view section.
Please note when using this function, you must turn off your images.
After clicking on the Highlights function icon, a pop-up window appears where you can select which highlight you want to use.
At this point, you might see the Preset Highlights in the top left-hand corner (see the GIF below) so it's worth explaining further.
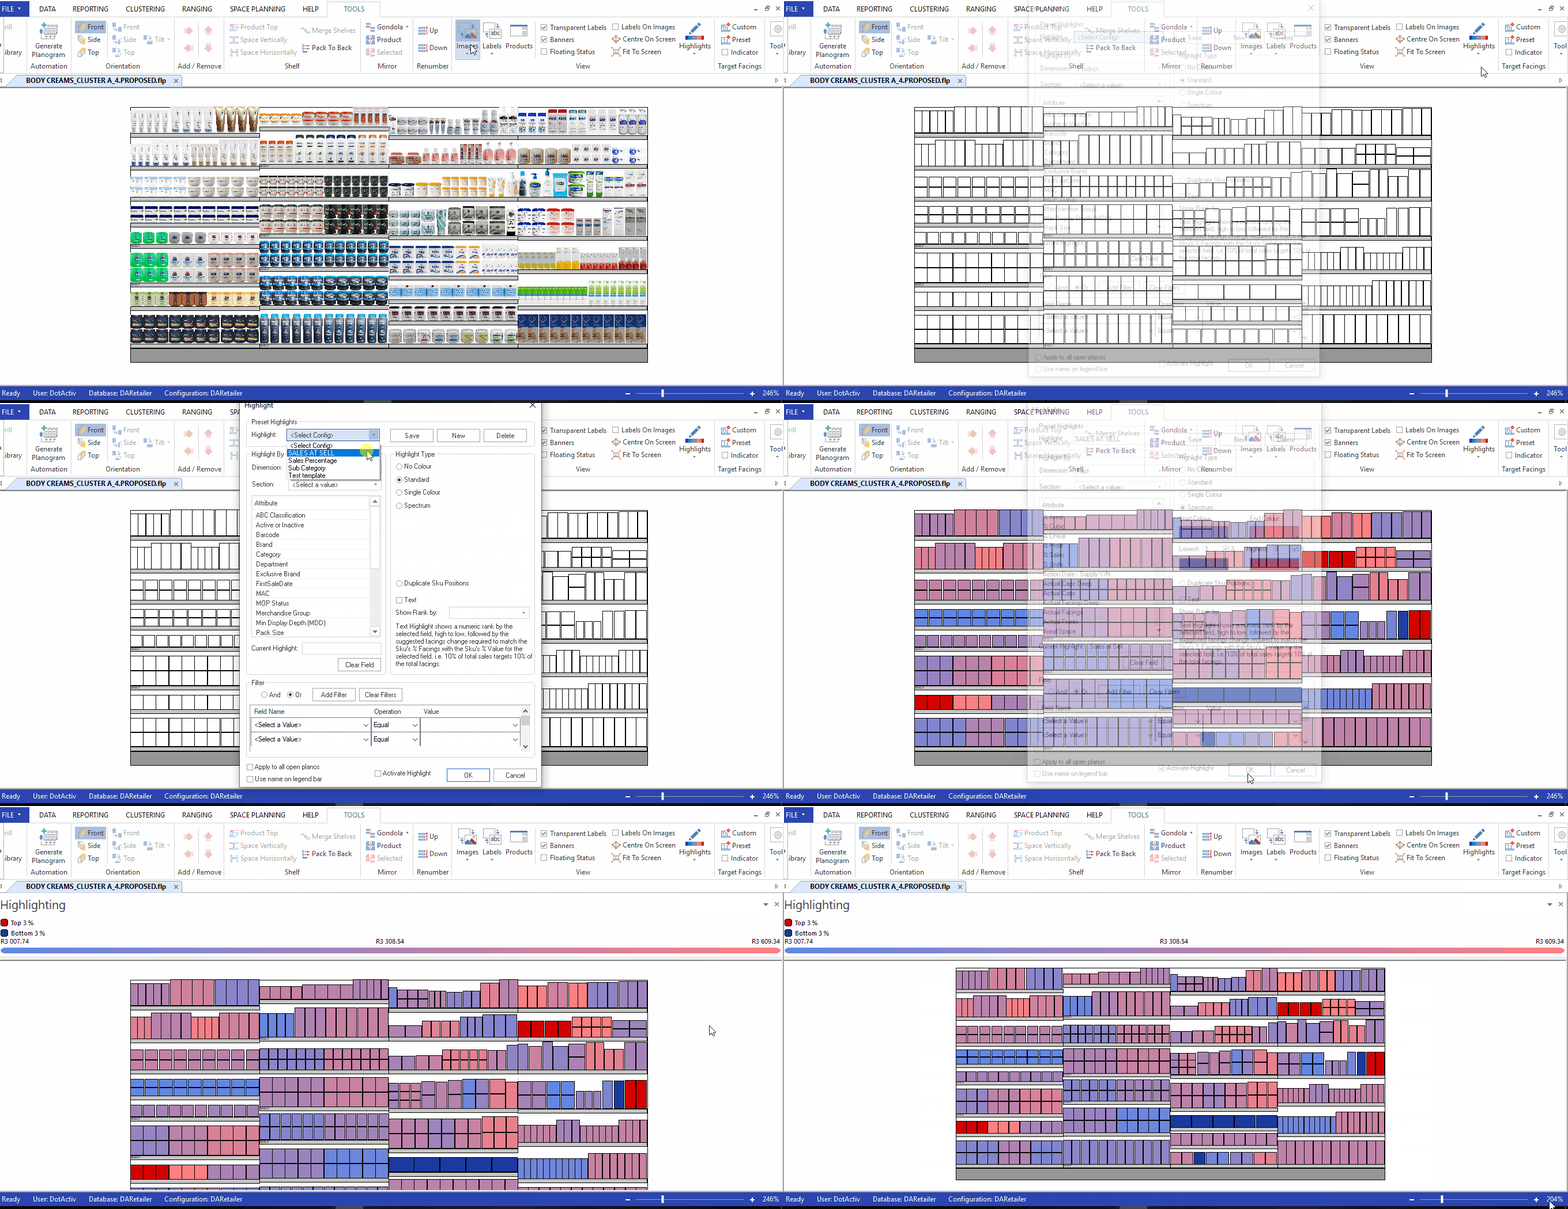
If you know you will always rely on the Sales at Sell highlight, which highlights your highest and lowest sellers based on sales, you can save it as a preset to access it easily the next time you use DotActiv software.
Thus, instead of manually selecting your highlighting field, you can choose the previously saved highlight and streamline the space planning process.
Choosing your planogram highlight
If you would like to select your highlighting field manually, here’s how you can do that:
1. Select your dimension
You can choose between Fact, Period, Market or Product.
2. Select your attribute
The DotActiv software offers many attributes, including Product Code and Barcode.
3. Select your highlighting type
Two of the most popular highlights used by our clients are the Standard and Spectrum highlights.
The Standard highlight applies primary colours to your desired attribute. For example, if you use a standard highlight indicating brand, the same brands are given the same colour, showing you how you have grouped your brands on your planogram.
Meanwhile, the Spectrum highlight creates a range of colours across the products on your planogram. For example, the lowest sales to the highest sales. It's important to note that you can only use this highlight option with numeric values such as sales and units.

However, what happens if you’ve forgotten which colours represent which fact? Select the Legend option from the Highlights dropdown menu, and a legend appears, indicating your selected colours and facts.
The Spectrum highlight also allows you to indicate the top-performing products as a percentage. For example, if you want to select the top 5% and bottom 5% of products based on sales, you can do that. That’s why you’ll often find the Spectrum highlight used when highlighting by DOS.

Why use DotActiv's Planogram Highlights function?
DotActiv's Highlights function aids the planogram generation process. That much we know. But what about explaining why it’s worth it? Below are a few benefits to expect when using this function (and others) in the DotActiv software.
Identify opportunity gaps
With DotActiv's Planogram Highlights function, you can identify opportunities and see where you can improve your planograms.
For example, the Sales at Sell highlight might indicate that you have overfaced a particular product.
By knowing which products are overfaced, you can make the necessary adjustment to your assortment. Making such changes allows you to stock more profitable products and reduce the possibility of holding items that fail to sell.
There is also the point that it can help you maximise the selling potential of your shelf space as you’re giving each of your products a data-driven space allocation.
Reduce shelf replenishment costs and out of stocks
Another benefit relates to reduced costs and especially around shelf replenishment.
Using the Highlights function, you can determine how to pack your shelf in a way that your shelf replenishment occurs at regular intervals rather than haphazardly. That means you don’t need to worry about additional or unnecessary labour costs.
Meanwhile, you’re ensuring product layout consistency, which improves the overall look and feel of your stores. Customers will want to shop in your stores because they know they can find what they want.
Improve the overall shopping experience
The Highlights Function is also perfect for visually displaying your category, sub-category, segment, or brand flow.
Let’s consider your brand flow as an example.
Determining the flow of your products is crucial in the planogram generation process. One of the merchandising principles our category and space planners implement is to group products by sub category and then by brand.
Another on-shelf merchandising principle is to display products from premium to economy. If you decide to merchandise like that, all your high-end products will appear first on the shelf, making it easier for your consumers to know which items are more expensive.
You also benefit from this merchandising principle since customers will see your high-priced products first.
Conclusion
DotActiv’s Planogram Highlights function is the perfect tool to help you create space-aware data-driven product layouts that reflect your merchandising strategies. When you achieve that, you can please your customers. When you please your customers, you can maximise the selling potential of your shelf space.
If you’re looking for a planogram development service that enables you to achieve your goals and objectives, speak to DotActiv.
You can book a complimentary exploratory consultation with a DotActiv expert today here to hear how we can help you. You can also browse our various software and service options on our online store here.
