

Planograms are important visual tools for communicating shelf plans. However, when read and interpreted correctly, planograms can provide so much more valuable information than just how products should be packed out on a shelf. Planograms need to be read and understood correctly to reap the full benefits.
When it comes to reading and understanding planograms, certain points need to be considered before, during, and after the planogram generation process.
![]()
Before: What do you need to set up before reading your planogram?
A few things need to be in place from the start - even before the planogram is created - to ensure it can be understood correctly.
First of all, you need to ensure that the data being used is clean. This means there are no duplicate values, commas, or incorrect period information which could result in mistakes on your planogram. You can check your product data using the product report as seen below.

You should also be aware of your category roles, strategies, and tactics to ensure this is translated into the planogram. This way, the retailer’s objectives can be achieved through data-driven shelf plans.
Once you have decided on your category roles, you will need to determine the flow of your products on the planogram.
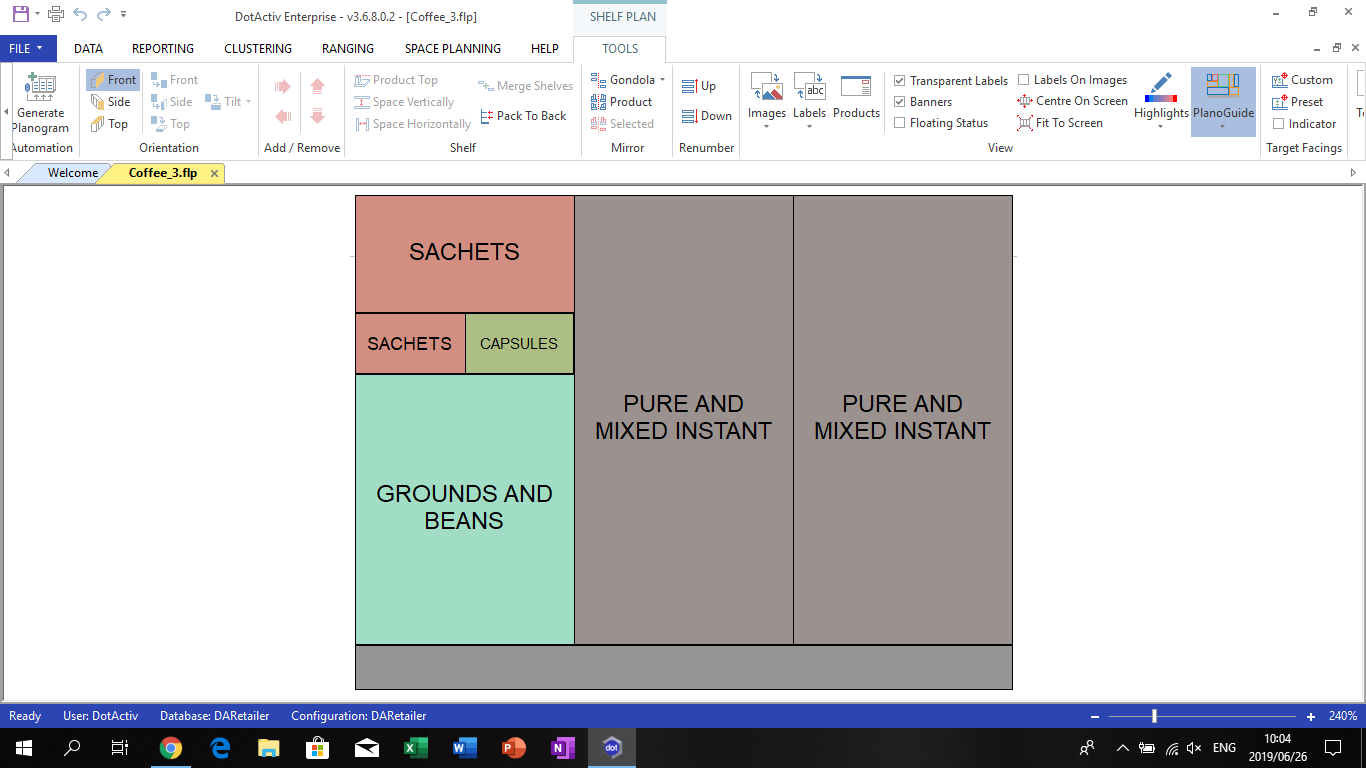
DotActiv recently introduced a new Plano Guide function that detects the layout of your planogram based on your selected criteria. For example, if you want to group your sub-categories, you can view a preview of your layout as seen below:
The retailer's merchandising principles are also important and aspects such as merchandising pack sizes from small to large etc. must be followed and adhered to consistently for the planogram to make sense.
Whether a planogram is based on a cluster or not also influences how it is read and understood. For example, a planogram intended for a specific region will not make sense if implemented in a different region’s store.
Your fixture dimensions must also be 100% correct. This has a significant impact on things such as the number of facings and capacity of products. This information is particularly valuable to merchandisers who will be packing products out of shelves.
Last but not least, high-quality, correct product images are extremely important in aiding the reading and interpretation of a planogram. The more a planogram looks as close as possible to the real thing, the better. ![]()
During: When building your planogram, what do you need to do?
When building a planogram, it is equally important to consider how your planogram will be read and understood. You must consider the correct product flow and ensure that it makes sense. This will result in your planogram being easy and logical to follow and interpret.
You must also consider your key factors like DOS and Weekly Movement. This is the only way to ensure planograms are data-driven and relevant. Products must also be placed on your planogram using the correct merchandising principles. For example, best sellers should ideally be placed at eye level.
![]()
After: What are the results of doing all of the above?
To aid a reader of a planogram and ensure an even deeper understanding of planograms, DotActiv’s Highlighting Function can be used to identify a vast array of aspects on the planogram such as brand, sub-category, segment, and so on. The Highlights Function can also be set up to highlight the products on the planogram as a spectrum; indicating low to high sales volume as seen in the GIF below:
DotActiv’s Reporting Function can also be used to gain a better understanding of planograms. There are various reports available to use. A report can, for example, be created to show the % forward share that each brand on the planogram is getting. Several measures can also be included in the report, for example, the % forward share can be compared to sales, units, and number of SKUs.
Other reports that can also be used include shelf reports, which, when used and read alongside the planogram, can provide exact information on where each product on the planogram is. Shelf reports can also provide details about specific products such as barcodes, the amount of facings the product should receive, and what the shelf fill capacity should be.
You can send your Plano & Shelf Report to your staff for implementation. They will receive a visual of what the final planogram needs to look like as well as an indication of where each product needs to be placed on the shelf as seen in the GIF below:
For a planogram to be successful it is important to consider how easily the planogram will be read and understood by various users. DotActiv’s all-in-one category management software provides the opportunity to create data-driven, visually appealing planograms that are easy to read and interpret.
Conclusion
DotActiv Lite, Pro, and Enterprise are all different versions of our category management software that allow you to drive category performance.
All three editions come standard with access to planogram generation, planogram reporting, technical support, access to DotActiv Academy, and one-on-one training. Trial any of DotActiv's software editions for free for 14 days.
.jpg?width=290&name=Tanya%20(1).jpg)