This is true - understanding what’s happening in your retail business at all times is critical to success. By knowing what’s happening, you can both anticipate and react appropriately. By analyzing your data and measuring outputs, you'll know if products are performing as expected or if you should replace them. That’s where DotActiv's Custom Planogram Reporting function, tailored to your business requirements, can help.
But what is this function? How does it benefit you? And how can you use and set up these reports in DotActiv? We answer all of these questions to help you understand the true impact that such a function can have on your business.

What is DotActiv's Custom Planogram Reporting function?
DotActiv's Custom Planogram Reporting function is customizable to your specific business requirements. You can report on different dimensions, including market, product, period, or fact. In short, you can analyze figures for virtually any store type, cluster, geographic location, hierarchy, or brand, to mention a few.
When using the Custom Reporting function, you have two options. You can either generate a report or use the report builder.
With the report builder, you can create a custom template. Creating a custom template ensures you get a standard reporting layout if you report on a specific business dimension. Thus, the templates save your shelf planners valuable time because you have a reliable starting point.
You can save templates as .drt (DotActiv Reporting Template) files, which you can share among other DotActiv users. You can also refresh your data within each template by mapping a specific data source.
The second option - generating a report - does what it says. You must have your templates set up to use this function.
Once your reports have loaded, you can make any changes to your chosen graphs and grids. There are multiple graphs available to you. For example, you can select a column, bar, funnel, pie, or pyramid graph. You can also insert different logos to customize your report further.

What are the benefits of using DotActiv's Custom Planogram Reporting function?
There are many benefits to using DotActiv's Custom Planogram Reporting function. For the sake of brevity, we summarized them into two main points.
You can create standard templates
Creating a customized template for use across departments ensures greater consistency when reporting on your performance measures. All your reports will have the same presentation layout and graph types.
For example, if you know you'll always report on product performance by sub-category, you can select this option when creating your template.
It also saves you time since you won't need to recreate your reports from scratch. Instead, you map the files you're currently working on and use your created template.
They also play a significant role in helping you provide a consistent brand image. If you're using your reports in a presentation to another company, you can ensure they visually represent the brand image that you're portraying as a company. That's possible by adding your company logos and colors to your custom reports.
You have multiple available reporting tools
We created the custom reporting function to ensure all users could build reports based on their business requirements.
For example, you might have slightly different requirements from your supplier when reporting on your planograms. You might be more interested in product performance by category, sub-category, and brand. With these reports, you can determine the correct product placement to increase your sales and units.
If you're a supplier, you might be more interested in performance by days of supply. These generated reports determine how many facings you must provide per store. You can also use the custom reporting function to determine how much stock each store requires.
That's not to say that some reports are more important than others. It all depends on which performance measures you are interested in most. You can match these measures with a suitable report in DotActiv's Custom Planogram Reporting function.

How do you use DotActiv's Custom Planogram Reporting function?
As we mentioned above, DotActiv's Custom Planogram Reporting function has two options - the report builder and generate a report. But how do you use each function?
Report Builder
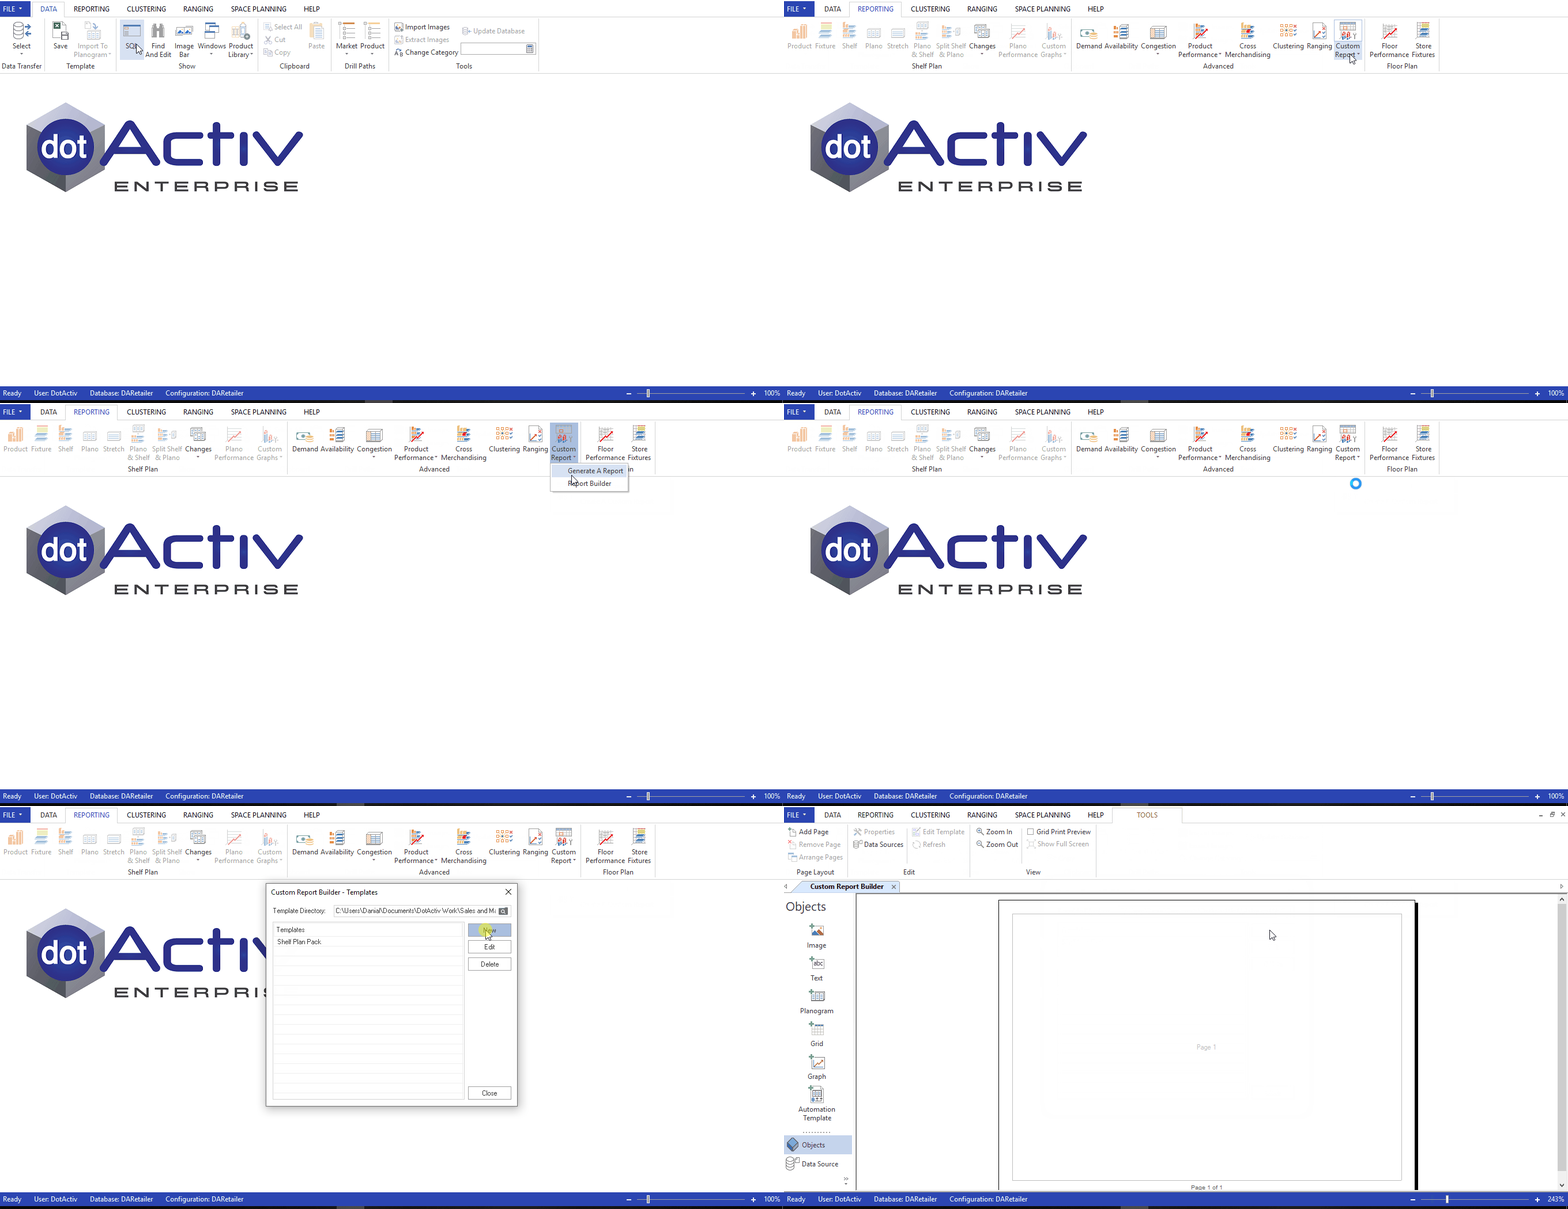
After opening the DotActiv software, select the Custom Report icon in the Reporting tab. In the drop-down menu, select the report builder.
A menu appears where you can create a new template, edit an existing template, or delete a template. Select the new template option, as seen in the GIF below.
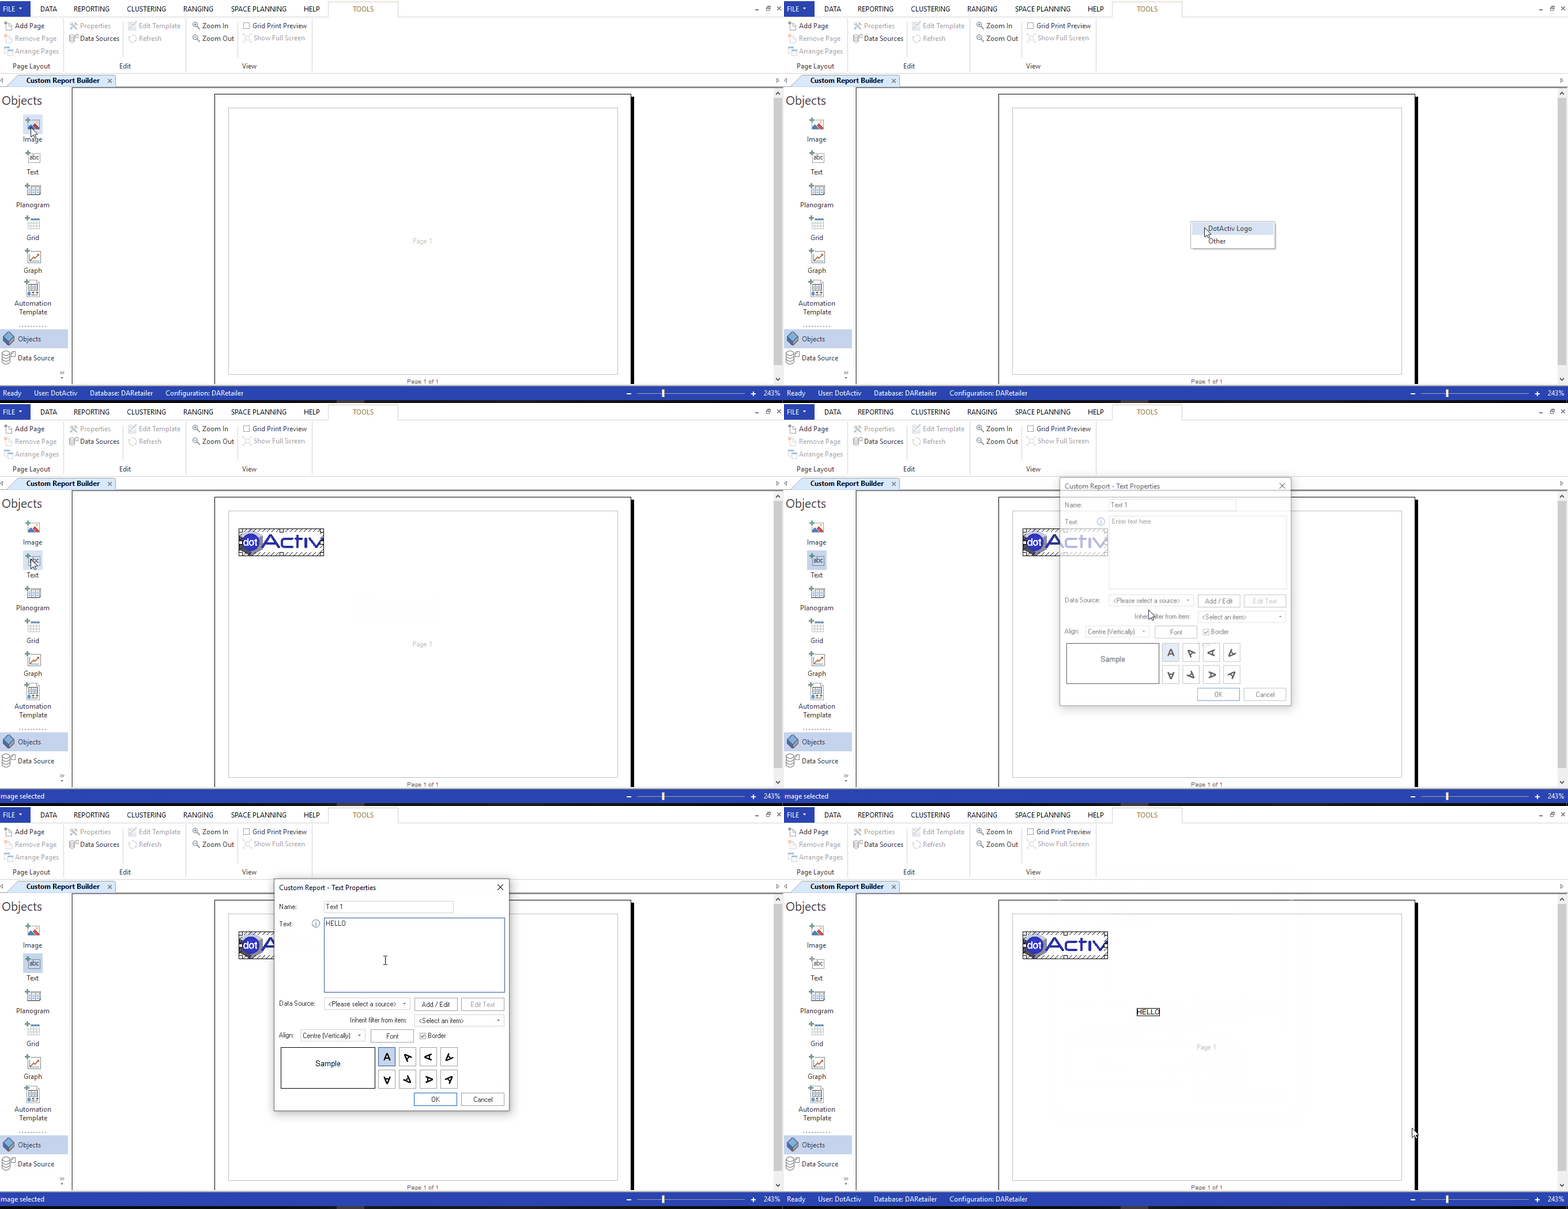
From here, you can begin creating your template. You can add an image by selecting the Image icon and then clicking on your chosen page. You can add text to your template in the same way as seen in the GIF below.
When inserting planograms, grids, and graphs, you have many options, meaning you can tailor your templates according to your specific requirements.
For example, you can apply filters, change layouts, and use various data sources. If you want to add a planogram to your template, select the Planogram icon and click on the desired page. From there, you need to give your planogram a name, select a data source and determine your product settings, as seen in the GIF below.
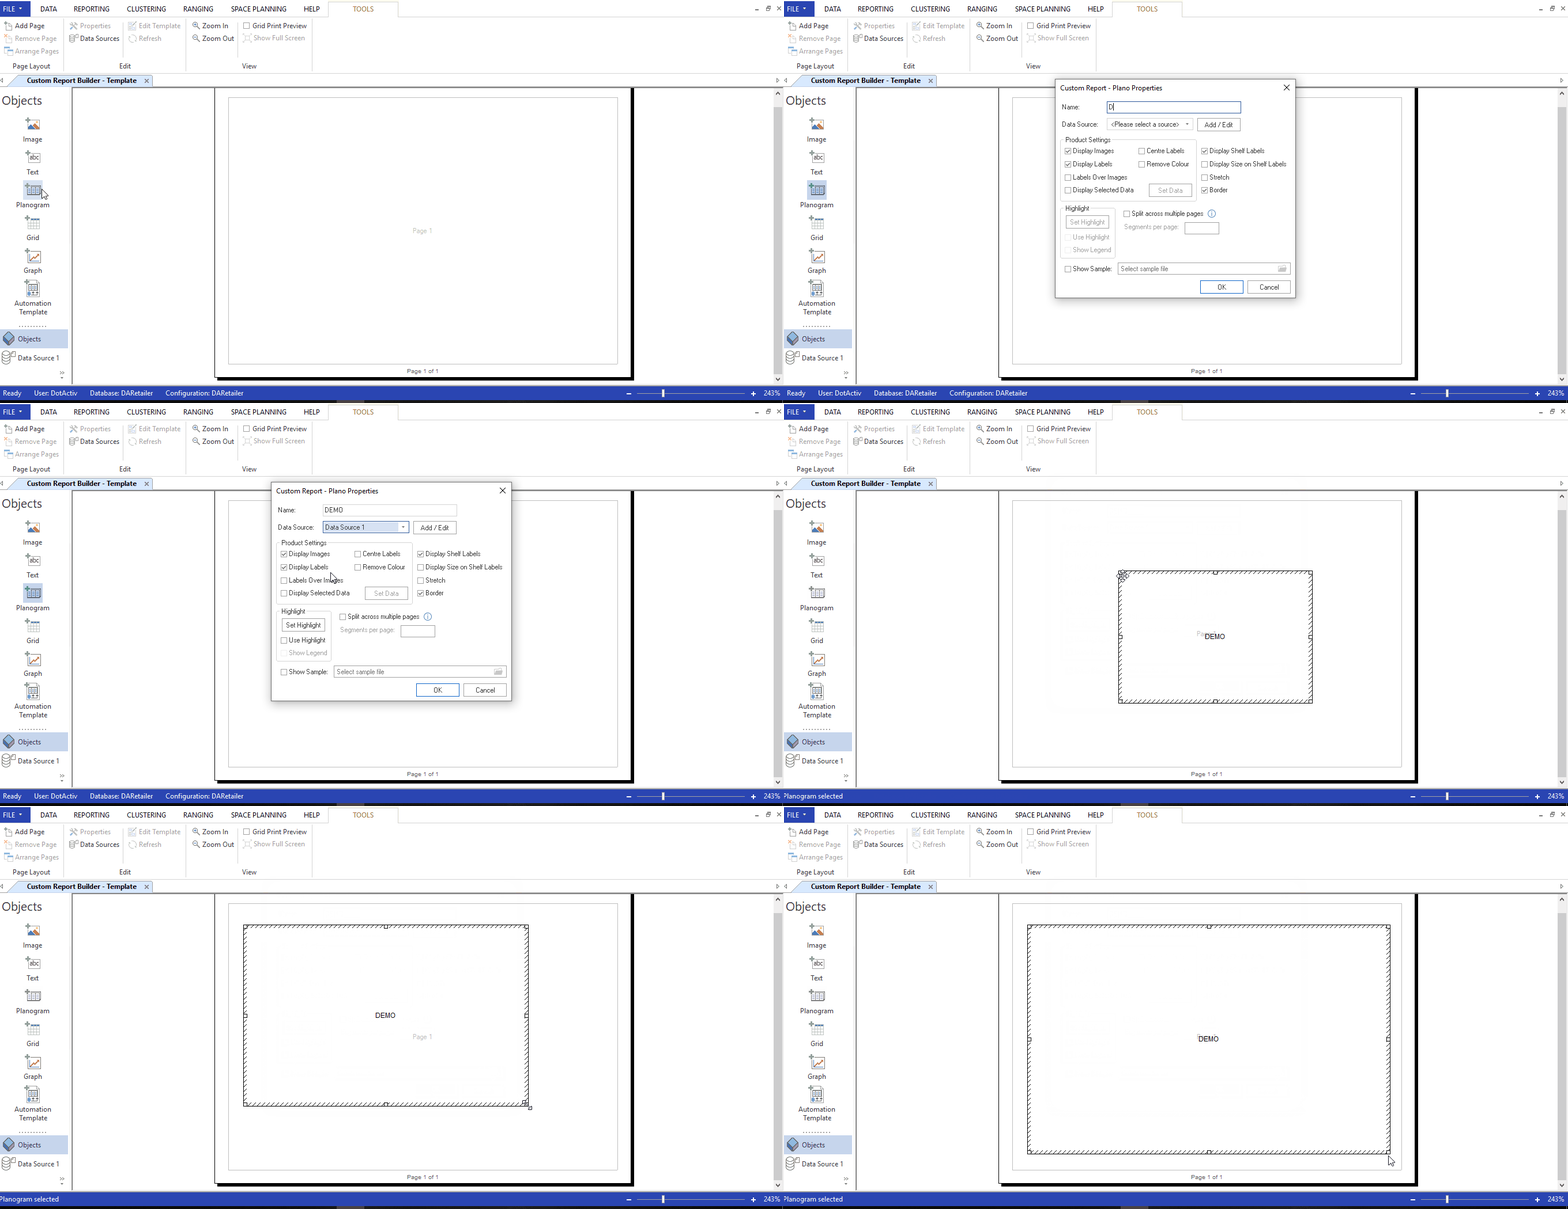
At this stage, you may wonder why your planogram is not appearing. That’s because you will only see your planogram once you generate your report. You only use the report builder to create a template to determine how you present your data. It won’t display your data until you have generated your report.
You can similarly insert Graphs. Your graphs also require a data source. As previously mentioned, DotActiv provides several different graph options. You can customize each graph by determining a color scheme, gradient type, display labels, and label content.
Furthermore, you can add an automation template, which allows you to create an automated planogram once you generate your report. You can show a planogram automation sample by providing a sample .FLP (planogram) file and sample .DPA (planogram automation) file. It allows you to see a completed planogram created using the Planogram Automation Function.
Generate a Report
Select the Custom Report icon in the Reporting tab. In the drop-down menu, select ‘Generate a Report.’ A pop-up window appears where you can find your saved template. Select the template you wish you use.
Next, you must map each configured data source to a specific file or directory before generating your report.
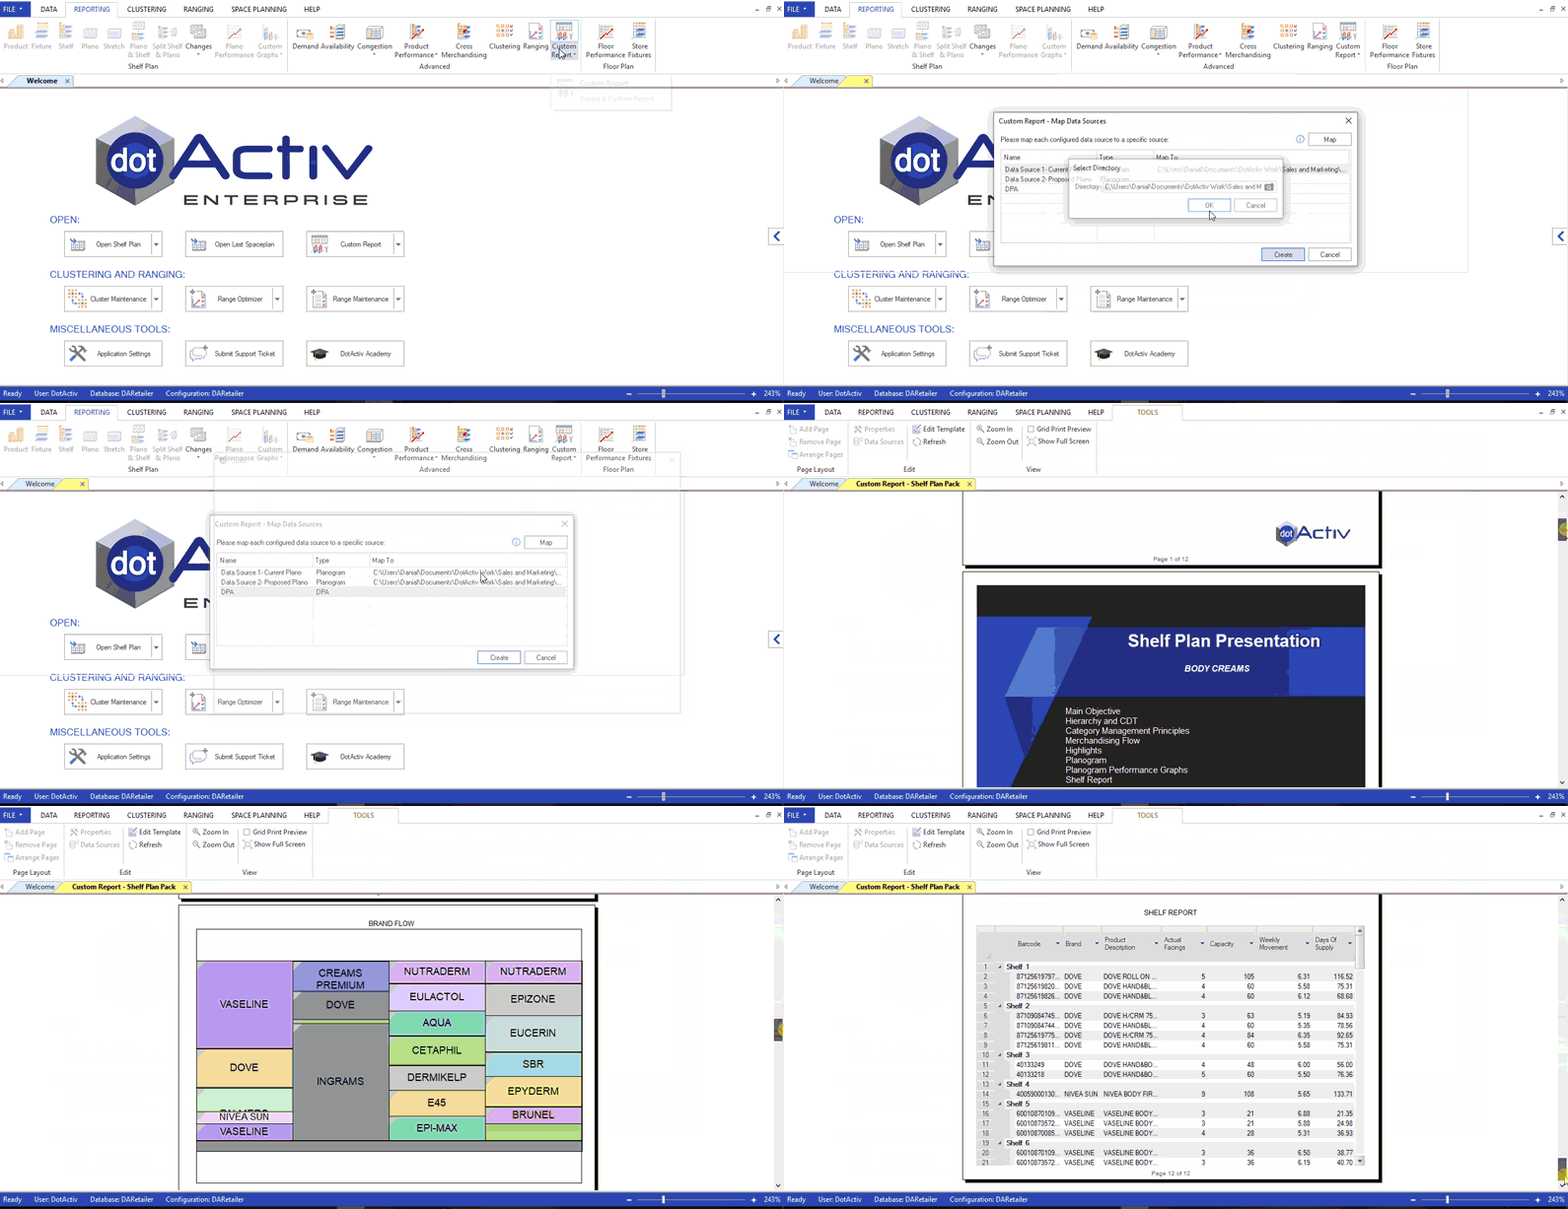
Once done, you can edit your template, refresh data from the database and zoom in and out as required. You can also drill down into your graphs to further report on your space evaluations by category, sub-category, days of supply, and more.
If you want to print your report, this is also possible using the Generate a Report function. Navigate to the Printer icon at the top left of your screen and select your desired printer. You can also print to PDF for future use.
Conclusion
DotActiv’s custom planogram reporting function is fully customizable to your specific business requirements. No matter what aspect of your retail business you want to report and measure, you have the ability to do that.
Are you looking for a category management solution that’ll help you understand what’s going on in your business? Or perhaps you need category management services that’ll help advise you while uncovering insights from your data?
Get complimentary advice from a DotActiv expert today when you book a meeting now.


