This fact is indisputable: the data you collect around your business is critical to understanding where you need to go. It’s the information you need to navigate to experience short- and long-term success. Of course, collecting your retail data is only half the battle. You also need to decipher it before putting the results into action. For that, you have DotActiv’s standard planogram reports.
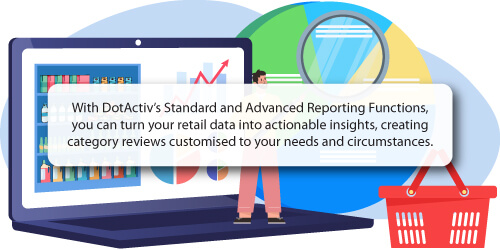
But what are DotActiv’s standard planogram reporting functions? Why is it worth using them? And how can you use each? We unpack these questions to help you gain a better understanding so that you can make full use of them in your business.
But what if you don’t have the time or resources to use these reports or build planograms? Our Planogram Development Services, backed by consultants with decades of combined retail expertise and knowledge will take care of all your needs.

What are DotActiv's Standard Planogram Reporting Functions?
DotActiv has 10 Standard Planogram Reporting Functions available within the software.
They are as follows:
- Product,
- Fixture,
- Shelf,
- Plano,
- Stretch,
- Plano & Shelf,
- Split Shelf & Plano,
- Changes,
- Plano Performance and
- Custom Graphs.
Each of these reports provides a distinct benefit in terms of measuring performance. Some of these reports help you to review your product and fixture details, and others allow you to determine your top and bottom-performing SKUs. To provide these benefits to you, all of the Standard Reporting Functions are data-driven.
Do you want to share your reports? No problem.
You can share the reports available in DotActiv software with other interested parties. That is made possible by printing them or saving them as PDFs.
Furthermore, the Standard Reporting Functions enable you to improve your space allocations by analysing different performance metrics.
For example, the reports ensure you align your %sales, %units and %capacity to ensure optimal space allocation.

What are the benefits of DotActiv’s Standard Planogram Reporting Functions?
DotActiv's Standard Planogram Reporting Functions provide various benefits, all of which assist you to build better planograms.
1. Summarise your product information, details and attributes
The Product, Fixture and Shelf Reports provide you with a summary of your product information, fixture details and shelf attributes, respectively.
Having these reports available in an easy-to-read format reduces the time it takes to create your planogram. You can use that time to focus on other aspects of your business.
2. Report printing options for your merchandising teams
You can use the Plano, Stretch, Plano & Shelf and Split Plano & Shelf Report to print your planogram in a PDF format for the end user. These reports also allow you to print in multiple formats as needed.
3. Evaluate changes between current and proposed planograms
The Changes Report allows you to compare your current and proposed planogram to understand any alterations you have made. You can gain insight into the improvements to your DOS and stock quantities.
4. Understand planogram performance
You can use the Plano Performance and Custom Graph to analyse a variety of performance measures. You can use these performance measures to achieve and fulfil your strategic and financial objectives.

How do you use DotActiv's Standard Planogram Reporting Functions?
Below is a detailed description of how each Standard Reporting Function in DotActiv software works.
When learning about our Standard Reporting Functions, it is recommended you consult DotActiv Academy, which provides step-by-step guidelines on each Reporting Function.
Product Report
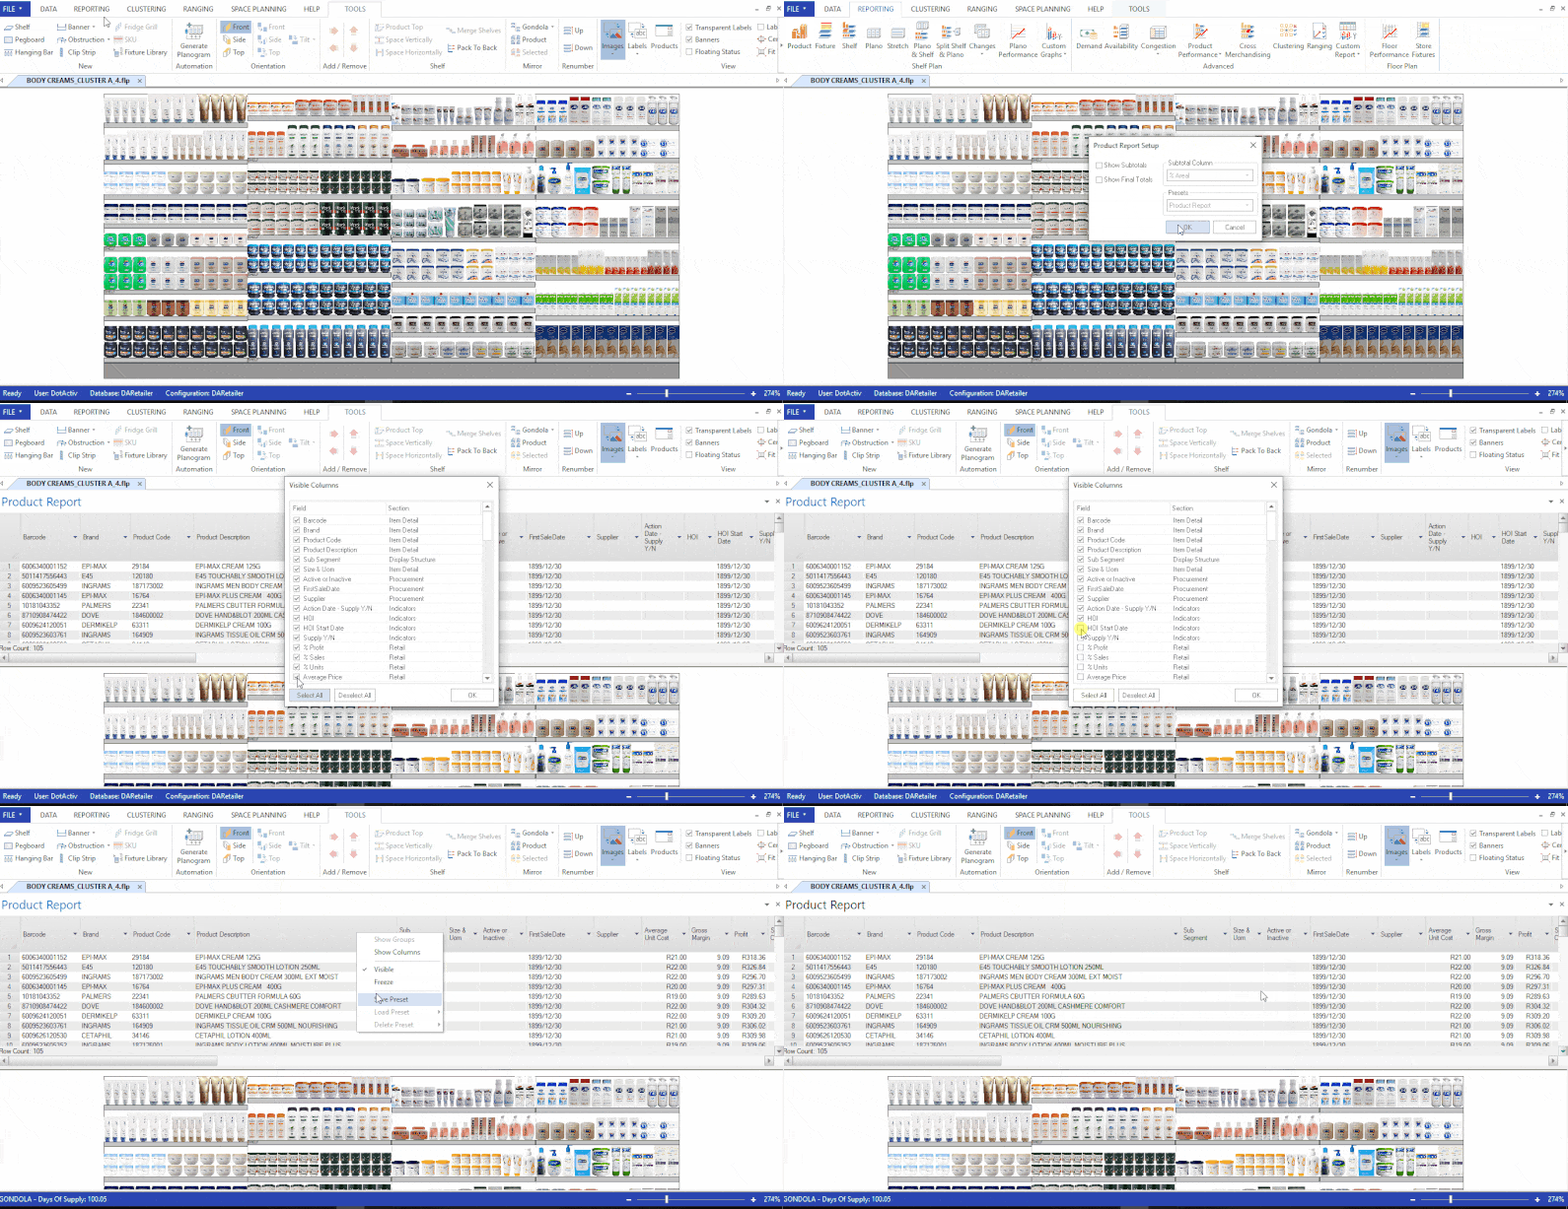
The Product Report shows you details of all products, even those not on the shelf. You can use this report to check if all your data has pulled through correctly once imported. It ensures you use accurate data when building your planogram.
You can also use the product report to add products to your planogram. Click on a product line and drag and drop it onto your shelf. You can select multiple products by using the CTRL key.
You can also sort and filter within the report by clicking the drop-down arrow in a column. To further customize, right-click on the header column and select ‘Show Columns’ to open all possible display fields. Once you have made your selections, save them as a preset to access in the future.
Fixture Report
The Fixture Report provides an overview of the fixtures currently on your planogram. As with the Product Report, you can click on the header to show all the columns available. You can also sort or filter each column by clicking on the drop-down.
If you select a shelf on your planogram, you will find it highlighted in your Fixture Report. You can view the gondola and shelf dimensions and other shelf facts.
Shelf Report
The Shelf Report provides you with a summary of what is on each shelf and is a guide to your in-store merchandisers. Within the report, you can right-click headings and add or remove columns as required.
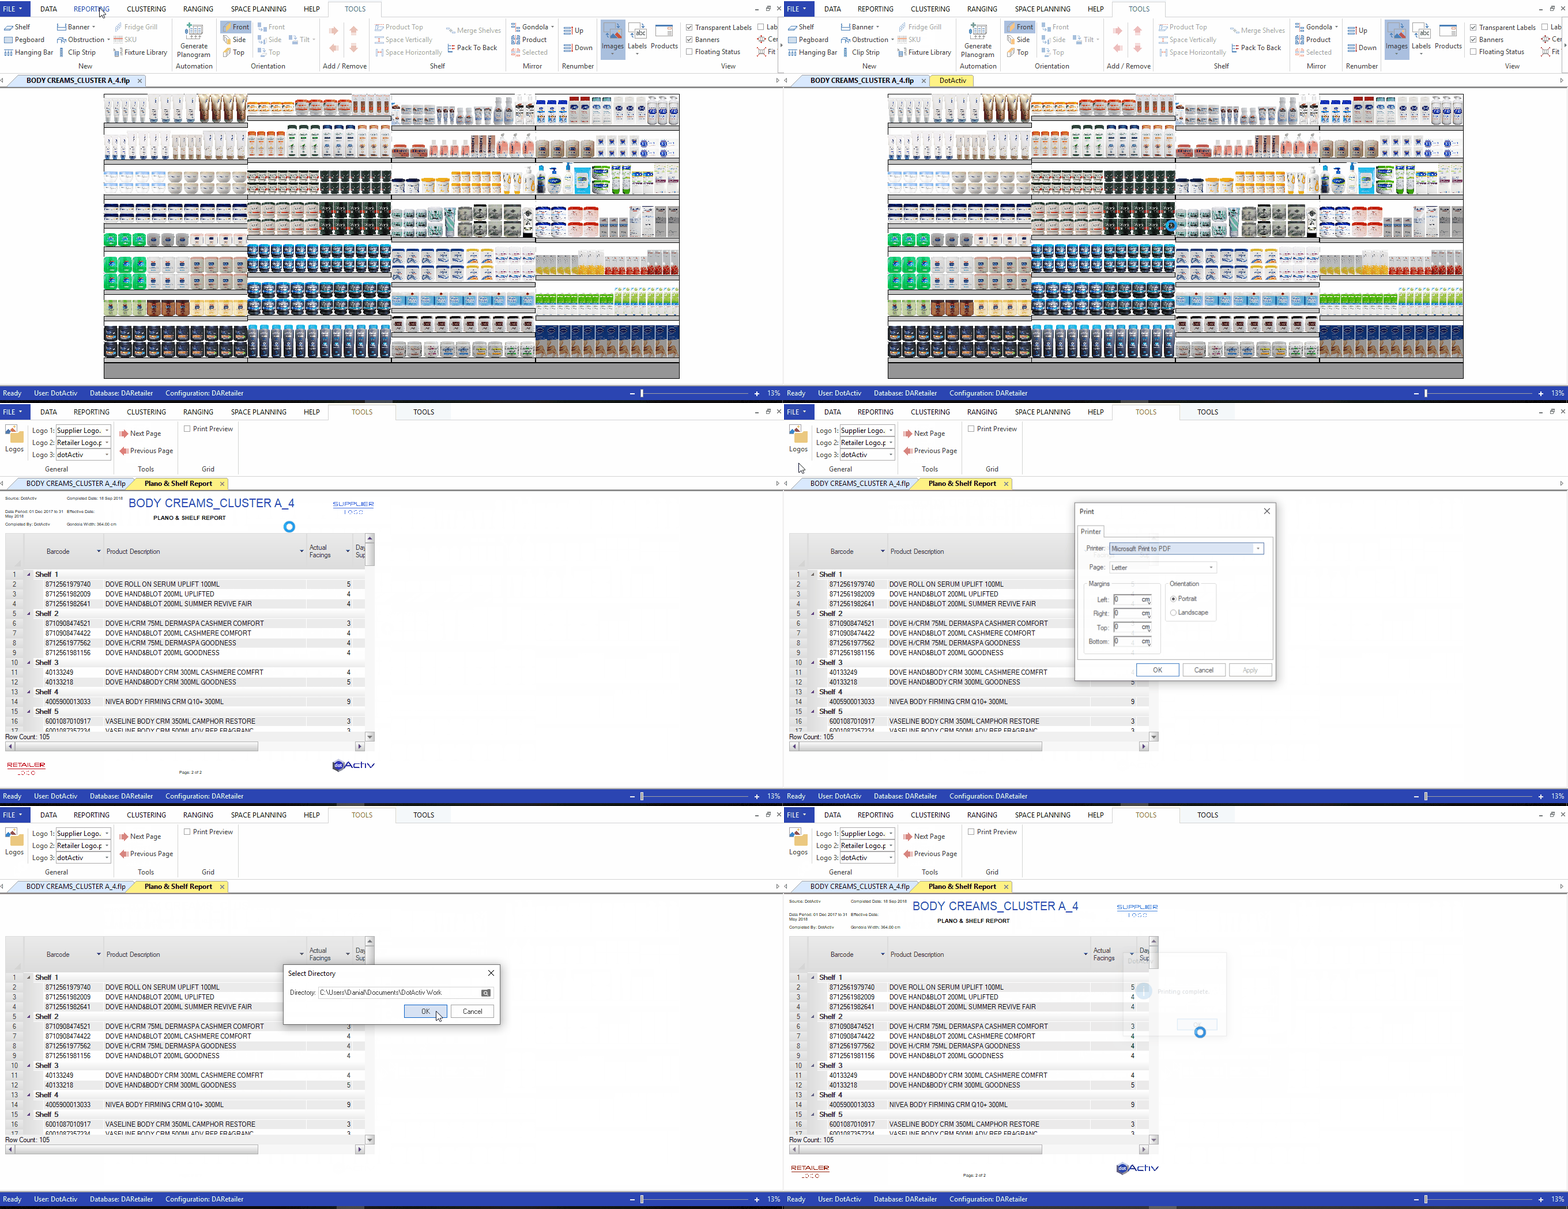
It is also possible to add logos to your Shelf Report. Adding logos to your Shelf Report is useful when presenting your report to clients. To add a logo, navigate to the logo icon within the Shelf Report and select your desired logo. You can choose a directory from which to pull your logos.
You also have the option to print or PDF your shelf report. With your Shelf Plan open, select the printer icon at the top-left of your screen and select the printer you want to use.
Alternatively, select print to PDF, which saves your PDF on your local machine.
Plano Report
The Plano Report is a print-ready version of your planogram. Once selected, a pop-up appears from which you can choose the information you’d like to display.
You can include images, labels over your images, shelf labels, segment sizes, product colour and the number of drops per page.
As with your Shelf Report, you can print to PDF for use when presenting your completed planogram.
Stretch Report
The Stretch Report will stretch your planogram drop by drop. Doing so makes it easier to print and more user-friendly to read.
It lists the barcode, product description, the number of facings and the Days of Supply (DOS) for each. To use this report, select the Stretch icon in the Reporting tab. From here, you can print to PDF as required.
Plano and Shelf Report
The Plano and Shelf Report combines the Plano and Shelf Report into one view. Once clicked, select your requirements in the pop-up window. You can add logos and print to PDF, as seen in the GIF below.
Split Shelf and Plano Report
Select the Split Shelf & Plano icon in the Reporting tab and select the details you want to show in the pop-up window.
The Split Shelf and Plano Report split your view to have the shelf report on the same page as the corresponding drop. DotActiv will make each page one drop combined with your Shelf Report.
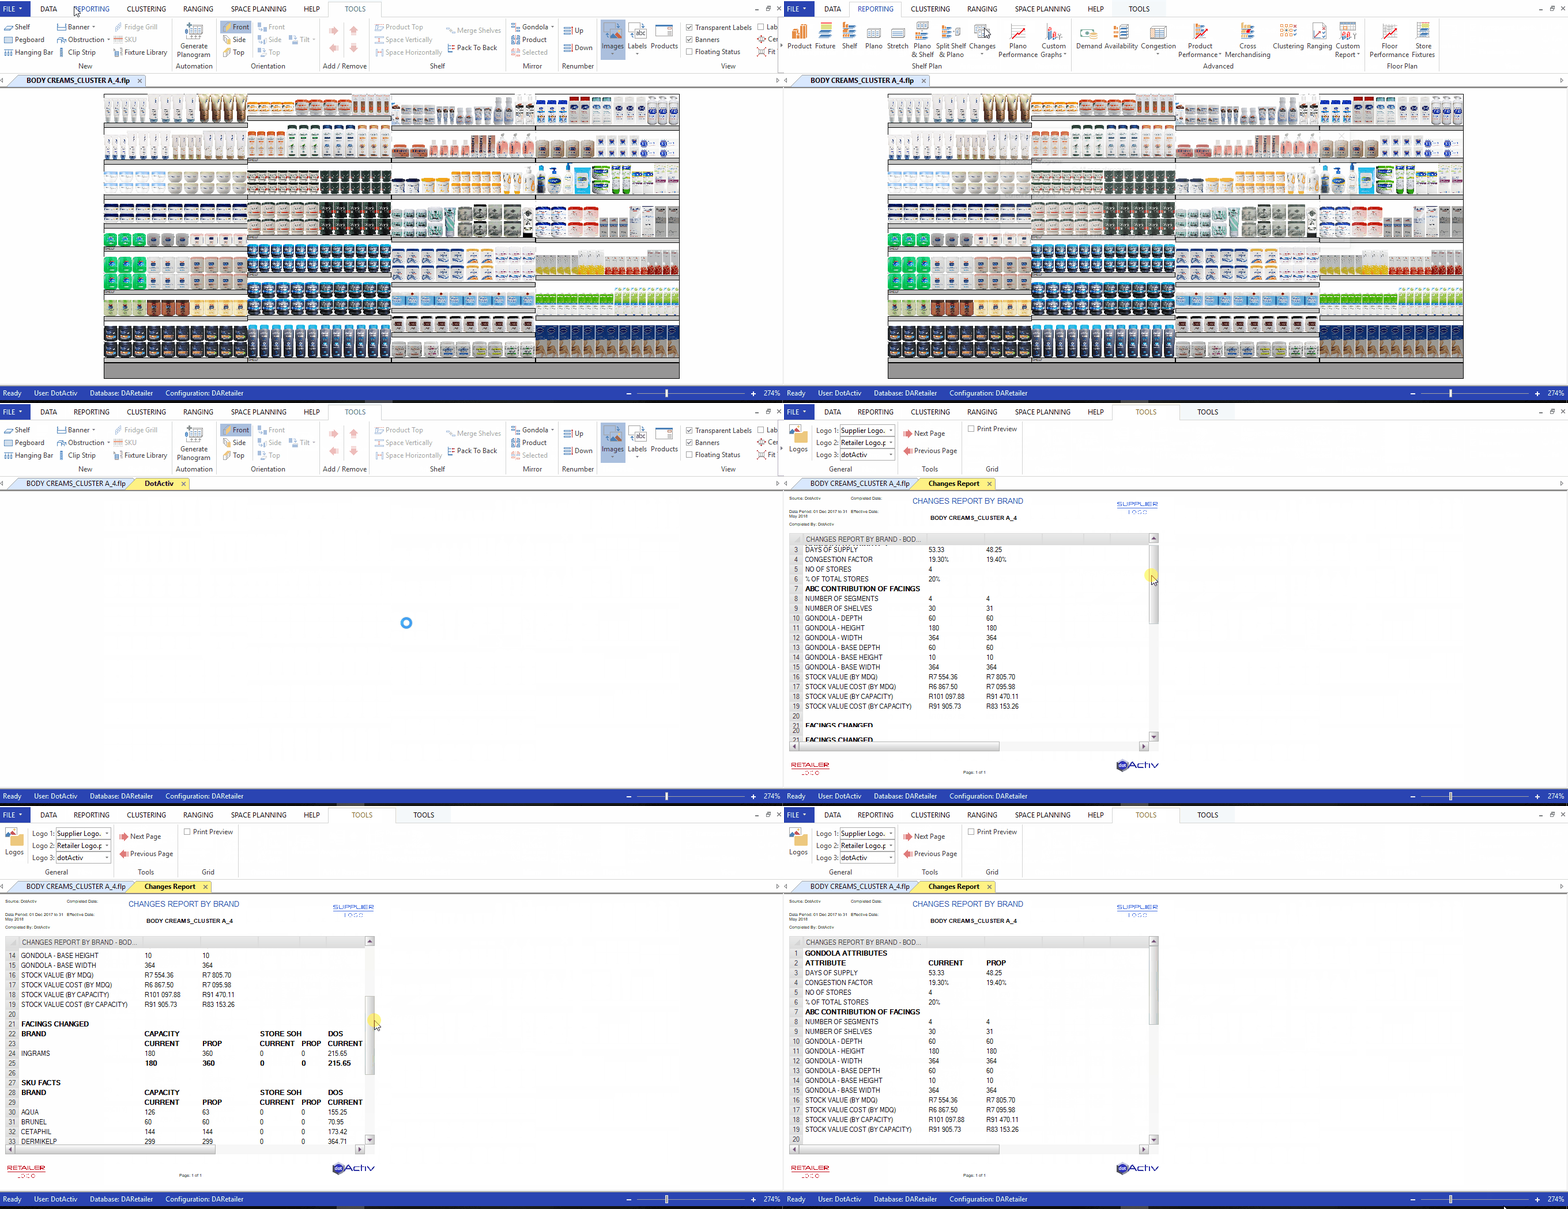
Changes Report
Once you select the Changes icon in the Reporting tab, a pop-up window asks you to map your planograms for comparison. Select the directory of your current and proposed planogram.
The Changes Report compares the product, market, period and other facts of your planogram against your proposed planogram, as seen in the GIF below.
Plano Performance
The Plano Performance Report generates a one-click report on the data in your planogram. You can see a summary of your category hierarchy, top and bottom performing SKUs by supplier, and your congestion rate.
If you view the next page, you can see your category flow and visual placement of the top and bottom 10% by sales and DOS.
On the last page, you can see the top and bottom 10% performing SKUs.
Custom Graphs
The Custom Graph is a popular reporting tool since you can build any graph you wish.
Start by selecting the Customer Graph icon in the Reporting tab. The top section provides a view of existing reports from which you can choose.
The bottom sections allow you to create a custom graph. You are required to give your report a name. You then need to select your data fields and the type of graph.
If you want to save the graph as a preset, select 'Save' once you have completed all your data fields.
Conclusion
DotActiv software provides you with a variety of standard reports that you can use to analyse your space and make better business decisions. From the basic Product and Fixture reports to the more complex Plano Performance and custom graphs, there is one for you no matter what you want to improve about your business.
Are you looking for a category management solution that’ll help you understand what’s going on in your business? Or perhaps you need category management services that’ll help advise you while uncovering insights from your data?
Get complimentary advice from a DotActiv expert today when you book a meeting now.
