

CLUSTER ANALYSIS
Cluster analysis is the process of grouping similar variables within the application of business analytics and data mining.
Retail clustering groups data and transforms it into information that you can use and understand. It allows you to implement any insights generated to improve and optimise your business processes.
WHAT IS CLUSTER ANALYSIS?
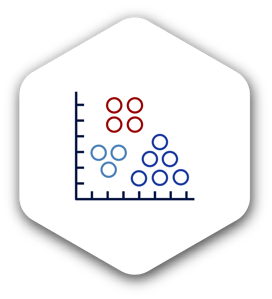 Cluster analysis is the process of grouping similar variables within the application of business analytics and data mining. You’d plot a data set on an axis and then visually map it into smaller groups based on the correspondences between them.
Retail clustering groups data and transforms it into information that you can use and understand. It allows you as a retailer or supplier to implement any insights generated to improve and optimise your business processes. This practice aims to retrieve information in the fastest manner for the discovery of knowledge and unidentified patterns.
Anomaly detection, data classification and cluster analysis are typical tasks conducted in the data mining process.
Clustering can also be referred to as data segmentation because this process partitions the data points into homogeneous groups.
To achieve meaningful results, you should use a clustering algorithm tailored to the market environment. It means that the algorithm must compute the amount and type of data in a time-efficient manner to produce accurate results.
As a retailer or supplier, you can use clustering to understand who your customer is and what drives their purchase decisions. It can help you to tailor your product offering and marketing strategies to your target market.
Want to understand the behaviour of your customers?
Learn how to use cluster analysis to optimise your product assortments, improve your category management efforts and better understand your customers in this free ebook.

CLUSTERING ALGORITHMS
The clustering model or algorithm you select should be capable of processing large datasets efficiently, effectively and timeously.
The most commonly used clustering algorithms for retail applications are:
- Partition-based clustering; and
- Hierarchical clustering.
After selecting your clustering model, you should analyse the category performance according to your Fact (sales), Market, Product and Period data. You can obtain this information through your point of sales (POS), loyalty and market data.
The clustering algorithm you chose must ensure that the data points within a cluster are similar while the data points in different clusters are dissimilar.
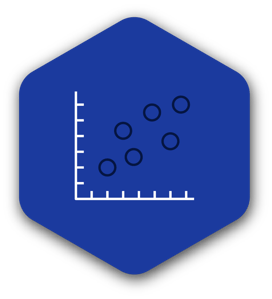
THE ELBOW METHOD
 You can calculate the number of clusters by minimising the within-cluster sum of squares (WCSS). You can plot data points on an axis where the X-axis represents the number of clusters and the Y-axis represents the WCSS for each cluster.
As the number of clusters increases, the WCSS decreases. To begin with, the rate of decreasing WCSS is steep. When the rate slows, it is shown by an ‘elbow’ or curve in the plot. The number of clusters at the elbow in the plot represents the optimum number of clusters for the dataset.
For retail application, this number should be considered against industry-level knowledge of the market and your business requirements for you to make a final decision.
When the cluster analysis runs, you allocate each data point to the nearest centroid. The algorithm will continue to assign data points to clusters until it reaches an average.
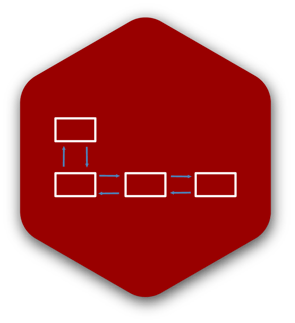
HIERARCHICAL CLUSTERING
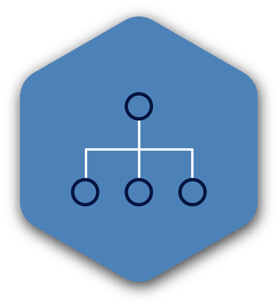
 This clustering model groups the clusters into a hierarchical tree to form a graph called a dendrogram.
When using this algorithm, you can select the number of clusters you would like to use based on the Elbow method or industry knowledge. Hierarchical clustering is the algorithm to use when you use a random dataset. It is because it produces clusters in a dendrogram that are easier to interpret than k-means clusters.
As the numbers of clusters increases, the accuracy of the hierarchical clustering algorithm improves compared to the K-means algorithm which becomes less accurate as the number of clusters increases.
CLUSTERING METHODS
 You can use different methods and variables to create clusters derived from data, reports, spreadsheets and speciality statistical analysis software.
When considering which method to use for your business, it is critical to consider your access to resources such as clean retail data, information technology (IT), marketing managers and buyers.
It is also critical to consider the integration and implementation of the cluster analysis. Once you receive the results, this information must be accessible to all business functions to used and implemented.
Before selecting your clustering technique, you must understand clustering principles:
POS DATA
Point of sale data is referred to as POS data. You can collect this data at your till point where transactions occurs. It is the type of data that is created and you can store directly from the retail POS system, which is comprised of software and hardware.
POS data can provide you with information about sales and units movement as well as the average retail selling price for specific products.
Store-related factors such as store code and store name may also be important to use for cluster analysis. If you only have access to POS data, you can use it to cluster products according to sales and units movement as well as the average retail selling price.
LOYALTY DATA
You can collect loyalty data from your customers when they use their loyalty card at a point of sale. This data allows you to collect demographic information about your consumers who provide it when they sign up for the loyalty scheme.

You can use this information along with your POS data and shopper basket data to profile and segment consumers based on their demographics and purchasing patterns. Shopper basket data allows you to understand which consumers buy which products, and what products are frequently purchased together.
With such data, your buyers can develop a product offering that satisfies the wants and needs of shoppers. It can also help you with as well as with product bundling. You can use this type of data for almost all types of clustering. That means you can select which attributes are most important to you and your business.
STORE-BASED VS CATEGORY-BASED CLUSTERING
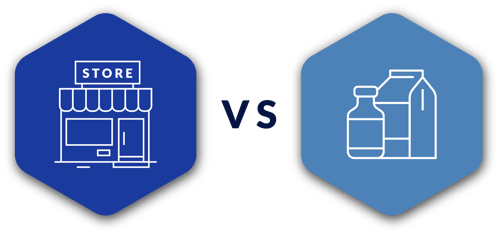
Store-based and category-based clustering are the predominant methods used by the retail sector to create customer-centric merchandising and product assortment tactics.
Originally, retailers adopted a store-based approach using top-down attributes such as store size, sales figures and geographic location to boost your operational efficiency. Store-based clustering can also be referred to as ‘store grouping’. This method is simple to understand and implement across a retail business. Entire stores are grouped based on similarities among them such as LSM, size, store format and performance data. This method may work well for retailers with a few store branches with distinct characteristics. For example, a retailer that has convenience stores, grocery stores and hypermarkets may choose to group their stores according to store format as the customer base for each will be relatively consistent within each format.
However, this method does not consider the different categories within a store, which are approached differently due to the different customer purchasing patterns, wants and needs of each.
As you can see in the image below, eight store branches have been grouped into three clusters. Within each cluster, the categories and product ranges will be exactly the same. This is because stores within the same cluster are said to serve the same consumer market.
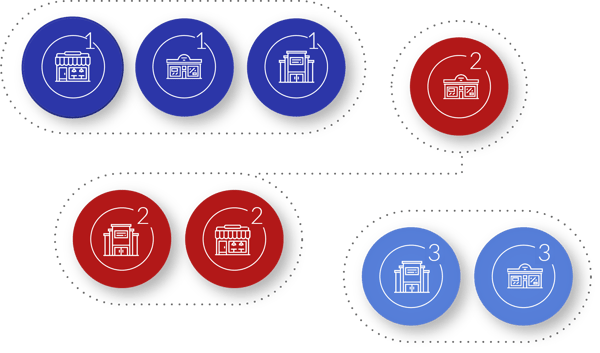
Example of store-based clustering
Today, retailers have moved towards a category-based approach to clustering which uses data across all store branches to cluster stores based on similarities in chosen variables. This means that each store may fall within a different cluster for each product category.
By using this method, you can create customer-focused assortment plans aimed at satisfying the needs of the target market. Category-based clustering is a more complicated method that takes more time and effort to implement. However, this will allow you to cater to the different customer markets that shop at various store branches, resulting in increased customer satisfaction and loyalty.
In the image below, you can see that we have clustered eight stores by category. This means that store 1, 3, 4, 5 and 7 will receive the same product range for hair care. This is because these stores are similar in terms of performance data, target market, LSM etc. for the hair care category.
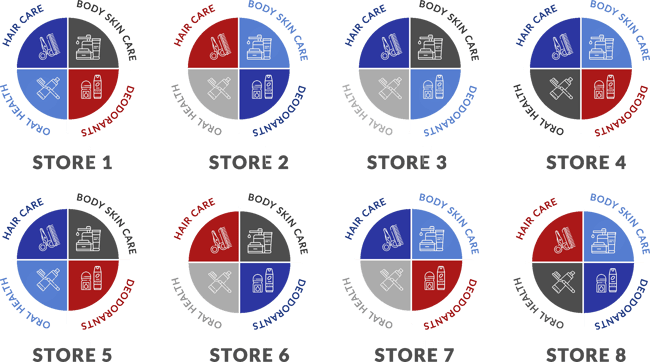
Example of category-based clustering
CLUSTER ANALYSIS IMPLEMENTATION
If you want to implement cluster analysis in your retail business, there are a few actions you can take. Presented in phases, within each phase are steps that can help you your cluster analysis efforts.
PHASE 1: PREPARE THE DATA AND DEVELOP YOUR PLAN
- What data sources do you have access to and would like to use?
- What are the benefits you want to achieve by implementing this process into the business’ category management plan?
- What capabilities does the business have or lack to execute the clustering process?
PHASE 2: ANALYSE THE DATA / DETERMINE THE BEST CLUSTERING METHOD
- Select the clustering algorithm to be used
- Determine the clustering method by deciding which variables would be most effective to use for clustering (e.g. to maximise revenue, cluster-based on store/category sales).
PHASE 3: EXECUTE
- Run the cluster analysis and evaluate the results
- Group stores into clusters for each product category
- Update store layouts, create new planograms and update strategies
- Clustering should be a dynamic process where clusters are re-evaluated periodically (e.g. 3/6 months).
CLUSTER ANALYSIS INTERPRETATION
CLUSTERING FOR CRM
Focus on delivering a highly personalised shopping experience for customers.
Customer relationship management (CRM) uses information technology (IT) to acquire, maintain and grow customer segments of the target market. CRM also assists you in building relationships and boosting customer loyalty by implementing customer-centric strategies built on data analytics. You can collect information on each of your customers to analyse their purchase history and buying behaviour.

The practice of CRM focuses on customer identification, attraction, development and retention. You can identify customers using customer segmentation and data mining techniques such as clustering.
Customers are attracted and developed using predictive analysis that determines future consumer behaviour. You can retain customers because CRM is a customer-centric approach to category management where a business develops a deep understanding of their customers to target them effectively.
THE CASE FOR USING CLUSTER ANALYSIS
BENEFITS CUSTOMER RELATIONSHIP MANAGEMENT
Within the context of CRM, retailers who implement clustering in their business will enjoy decreased customer acquisition costs and improvements in customer understanding and service, resulting in increased customer satisfaction, retention and loyalty.
The profitability of lucrative market segments increases as your business identifies and targets them.
LET DOTACTIV HELP YOU BRING YOUR CATEGORY PLANS TO LIFE
Gain in-depth insights into the behaviour of your target market and improve your strategic decision-making.
With DotActiv's cluster optimization services, you'll get access to category-based cluster optimization opportunities, which will enable you to understand and adapt to shopper behaviour at scale.

WANT TO UNDERSTAND THE BEHAVIOUR OF YOUR CUSTOMERS?
Learn how to use cluster analysis to optimise your product assortments, improve your category management efforts and better understand your customers in this free ebook.