While the goal is the same, every retail buyer has a different way of realising their category strategy. Therefore, a category manager uses data-driven planograms as powerful tools to successfully implement their strategy by determining exactly where and how products should be placed in a store. This allows for effective stock control, category alignment and essentially maximises sales.
Analyze your retail data correctly
Out of stocks, poor product performance and excess inventory are all examples of problems that can be uncovered with thorough data analysis.
As a category manager, you can use data to analyse the shopping behaviours of your consumers and thereby select product ranges, determine the days of supply, and plan the placement of products to ensure optimal product performance. In this, store planning does not only relate to the macro space but also to the micro space - the shelf plan.
When space planning, you’d need to consider each department right down to the individual shelf. This is done by creating a planogram.
A planogram is a data-driven tool which combines sales data and retail space data and thereby makes your strategy come to life. You can use proper data analysis to identify the top performers and bottom performers in your range, which is necessary for proper space allocation of products. This also allows you to get an idea of the bigger picture before putting products on a shelf.
Products are firstly grouped by category, which is then further broken down depending on the predetermined product flow. Merchandising rules and principles are considered before space allocation as it determines the hierarchy of your range.
For example, merchandising by brand or sub-category.
While building planograms, you would take your days of supply (DOS) into consideration. This is determined by sales data and refers to the number of days it will take for a product on the shelf to sell out. This is important to ensure that products in a category sell out evenly and that your stock control is accurate.
 You can use product placement
The relationship between product visibility on a shelf and product performance is proven.
You can use data-driven planograms to understand the performance of your shelf space and to determine which products should be placed where.
Before placing products on a planogram, you need to decide on your strategy for that category and plan the planogram to support the strategy. Each product within the category needs to be considered individually.
For example, is it an economy or premium product? Is it high-margin or low-margin? What is the minimum amount of facings? The placement on the shelf can then be decided on, keeping the number of facings and the level at which it is placed, in mind. Placing a product at eye-level with more than one facing is likely to yield a higher sell-through rate than placing a product at the base of your gondola.
Considering the placement of new product listings, products need to be placed in a position where they will be visible to the customer to ensure product awareness. The general assumption is that new listings are to be placed at or around eye-level, with a minimum of two facings.
Similarly, products that are exiting the market or being discontinued must also be considered. Usually, you’d reduce these products to one facing and place them at a shelf level which is not a hotspot. Alternatively, the item is placed into a dump bin in the store.
Poor product placement can have a significant effect on sales. Placing a poor performing product in a space where a fast-moving product should have been can cause a loss in sales. Also, giving a poor performing product too many facings will result in excess stock on the shelf and inconsistent days of supply on your gondola. Through data-driven planograms, you can ensure that each aspect of product placement has been considered.
You can ensure category alignment across stores
Category alignment is considered by category managers to ensure layout consistency across stores. Category alignment contributes to the brand identity of your store (or brands depending if you are a category manager for a supplier or retailer), consumers expectations and essentially the overall shopper experience.
You can decide on your merchandising principles and through centralised space planning, apply them to each category for different stores, thus creating consistency across stores in different locations.
Your customers have a perception of your store and due to this, you create a certain expectation, no matter the location of your store.
For example, a customer walking into one of your stores in Cape Town will expect to find a specific product in the same product category as they would find it in your store in Johannesburg.
This is where planograms come into play. They can communicate a common goal between the stores, and a consistent product layout can be implemented to execute your strategy correctly. This contributes to a positive experience for your customers as it creates a seamless shopping experience by avoiding shopper confusion and frustration within a store. It also creates a feeling of familiarity and comfort while shopping.
 Maximising sales
You can use planograms to improve space efficiency in your store by balancing the sales contribution and the space allocated to each product, thereby maximising your sales.
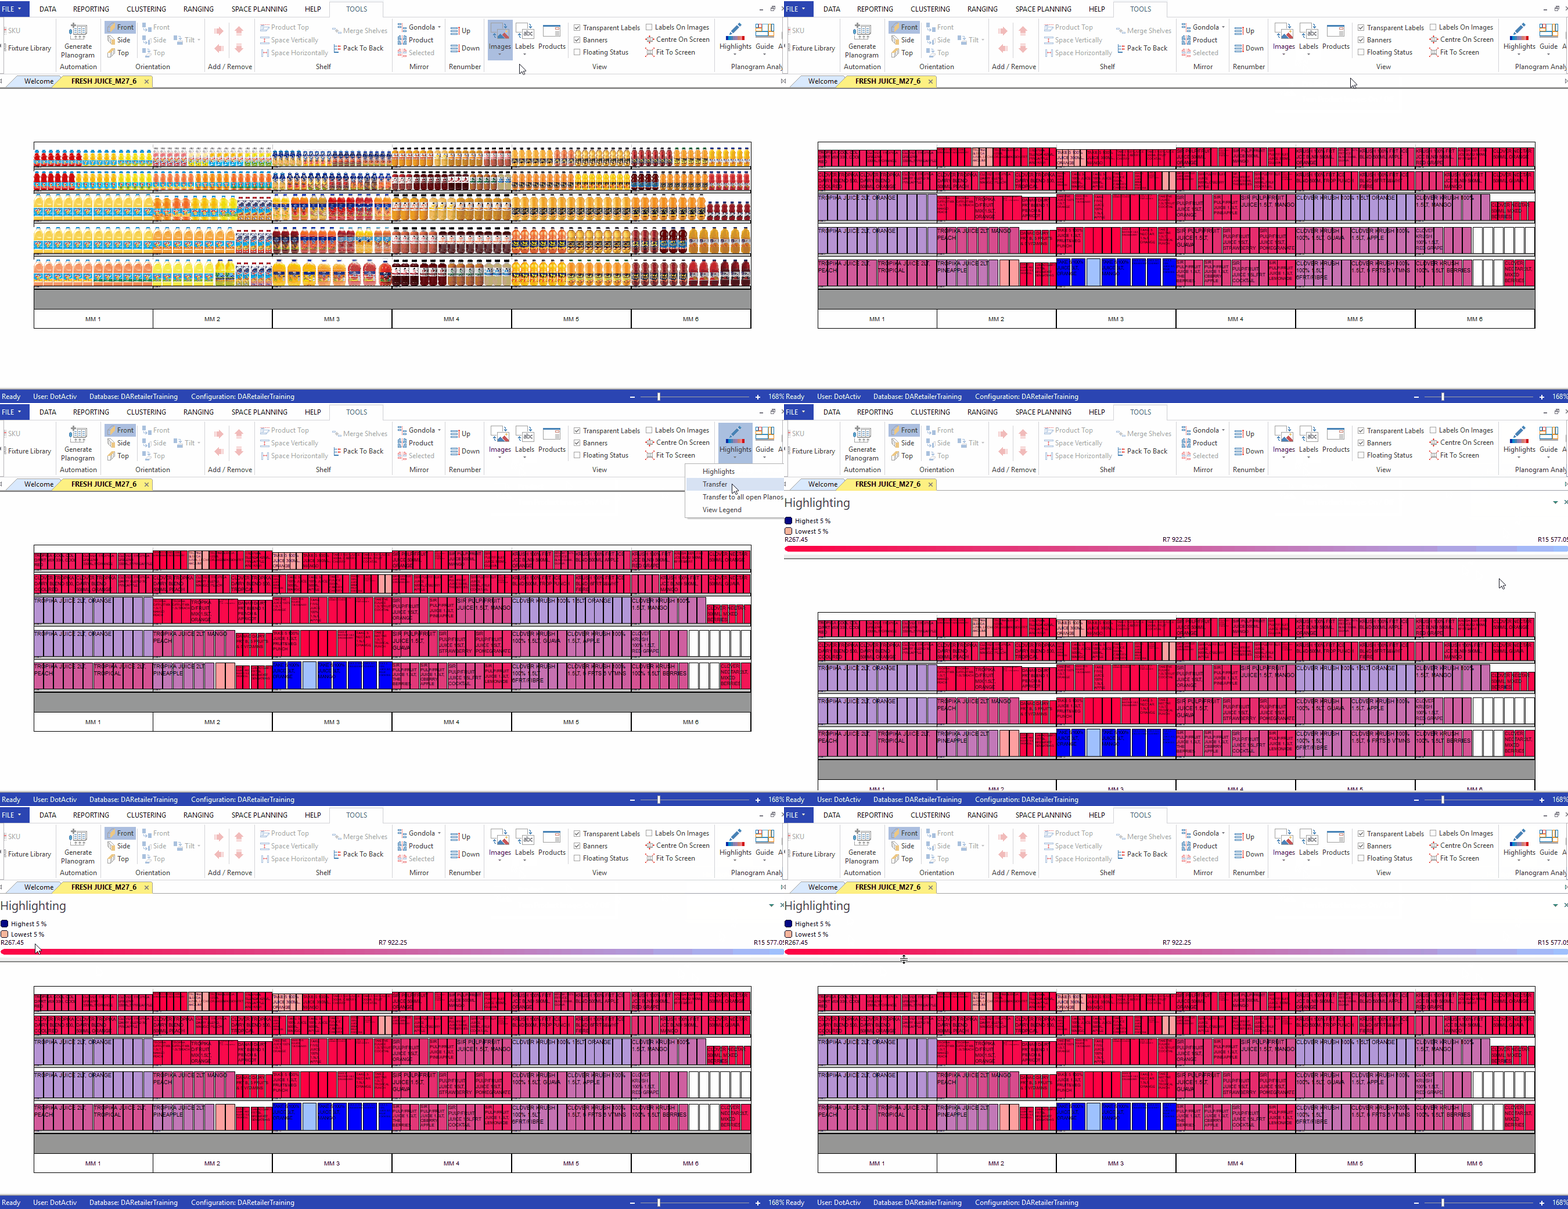
Within the DotActiv software, for example, you can apply highlights to a planogram to analyse the product performance through a visual report as shown below.

This highlights the best performing products as well as the lowest-performing products, in terms of the number of units sold and the profitability. You can then implement changes to the planogram to take full advantage of growth opportunities.
You can do a top 10 and bottom 10 analysis by looking at the range as a whole, whereby you can determine your fast-moving and slow-moving products. Sometimes it’s more valuable for you to cut a dog line - a product which sells but not very well. Even though you are gaining some sales from them, it could be more profitable to allocate the space to a faster-moving product.
Let’s look at this concept practically. Due to a consumer trend, a specific flavour of sauce suddenly increases drastically. However, due to a lack of data analysis, the product is kept on the bottom shelf and you fail to increase the number of facings. Thus, the full sales potential of this item will not be reached as the space allocation and placement of the product have not been adjusted accordingly. Even if more stock of this item is being ordered, shelf replenishment will become an issue as days of supply have not been considered.
Conclusion
You can avoid situations such as these through using data-driven planograms to plan product placement, stock control and category alignment to maximise profits and effectively bring the category manager’s strategy to life.


