

If you want to understand the impact of space management decisions made at store level, there is really only one starting point. That’s your data. You need to interrogate your data if you want answers to the most pertinent questions about your business. Of course, when any conversation turns to data, it should also include questions about your reporting tools.
To be more specific, it should revolve around asking yourself which reports you should use to get the answers you seek. Fortunately, there are a wide range of reports available to you if you use specialised category management software.
In the context of understanding the impact of making any changes to your space, we can narrow that down to seven reports. As a side note, these standard or push reports are accessible to DotActiv Pro and Enterprise users.
The Demand Report
The first such report that is a must-have is a Demand Report.
The Demand Report helps you to answer questions on the impact of making a change to your planogram. This impact is at a monetary level.
For example, what would be the monetary impact if you were to add a handful of new products to a planogram? Would it be positive or negative? Or, if you wanted to roll out a new planogram; after comparing the current to the proposed planogram, what is the financial impact? Would it make sense to roll out the new planogram or not?
After navigating to the demand report in DotActiv under the Reporting tab, as seen below, a pop-up window will appear.
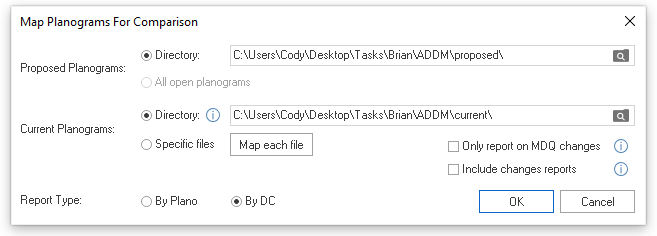
Here, you can choose the proposed and current planogram that you’d like to compare. Along with that, you can choose your report type. Do you want to report by planogram or by distribution centre (DC)? You can choose to report on Minimum Display Quantity (MDQ) changes. If you untick the checkbox, your report will include all products on the shelf regardless of an MDQ change.
If you want, you can also generate changes reports along with your Additional Demand (ADDM) report using the same set of compared planograms by ticking the ‘Include changes reports’ box.
Besides the impact of changing from one planogram to the next, the Demand Report also looks at the product facings that change as well as any products that you may have added to your planogram.
From there, it takes the information found and works out how much stock each of your stores requires to meet demand. That’s after taking into account any existing stock at each of your stores as well as your distribution centres.
If it finds that you need more stock, it works out how much you’d need to order to ensure there are no surprises in your supply chain once you publish your planograms.
As for its importance, that’s straightforward. As alluded to above, it pre-warns you of any stock shortages. Depending on your timing of any changes to your planogram, not considering it can also affect your cash flow.

The Availability Report
While the Demand Report focuses on the monetary impact of changes to your planogram, it’s difficult, if not impossible, to make such changes without first understanding how much stock you have available.
That’s where an Availability Report comes into play. It analyses and details what stock availability there is per store.
As seen below, after selecting Availability Report, a pop-up window appears where you can select your report criteria. You can choose either all stores, by ticking the checkbox or select a specific store. From there, you can select the department.
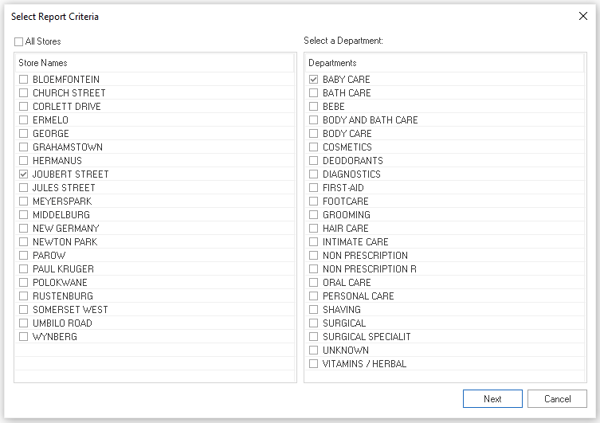
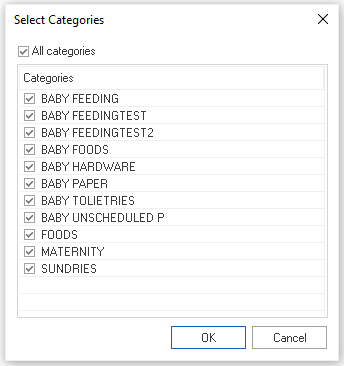
Next up, select the category you’re working with. You can also choose all categories if you wish.
After clicking ‘OK’, you’re presented with your Availability Report as well as your Availability Report Total. Columns within the Availability Report includes Category, Store Code, Store Name, Product Code, Product Description, POG, Supply, MDQ, Store Balance Quantity, Total On Shelf Availability, Actual Facings Availability and One Facing Availability.
Let's say, for example; you want to add more of a certain product to a planogram to increase your sales for the Baby Care department. If you do, will you have enough stock in your storeroom to meet demand? If not, the above report highlights any stock shortages, which could indicate any potential issues in your supply chain, which could, in turn, affect future sales.
On top of detailing stock availability, it also shows your stock in relation to its current facings and minimum display depth (MDD) requirements. You can use MDD when setting a minimum limit to the number of products that run deep into a given shelf.
Besides highlighting potential issues with your supply chain, it can pinpoint any problems at a store level. That includes ensuring you give your various products the correct shelf space according to sales.

The Congestion Report
If you want to understand how many products you have on a given planogram, there is the Congestion Report.
So how does it work?
By taking all the products on your planogram and reducing them to one facing, it measures the amount of area these products take up versus the area you have available. That is your congestion percentage. What’s critical to note here is that there is no defined target. The congestion percentage differs according to the category or product.
For example; for Stationery Pens, you would want a lower congestion percentage as the products are small and susceptible to making your planogram and shelf look busy. By adding too many products to your planogram; when the time comes to place these items, you’ll end up with a messy shelf.
But; you could get away with a higher congestion percentage for a Baby Diaper category. That’s because the products are larger. Generally, a category with products that have large dimensions can have a high congestion percentage.
Let’s consider setting it up. After selecting Congestion Report, you can set up your report by store, by cluster or by category. By selecting stores, you can then choose your section - Category, Column - Baby Foods and then Value. You can choose to look at all of your stores or only a select few.
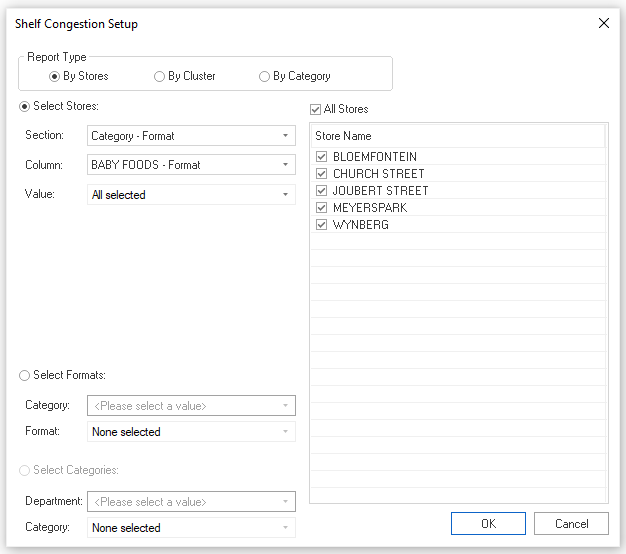
Once satisfied, and after clicking ‘OK’, you’re presented with the Shelf Congestion Report. The report includes columns that calculate your number of drops (NOD), Forward Standard Modular Equivalent (SME), Cubic Standard Modular Equivalent (SME) and Average Congestion.
As for why it’s critical to consult such a report, it’s worth noting that it’s not only about you. It also has a significant impact on the shopping experience of your customers.
Studies have shown that regardless of the category, when customers have too many options, they struggle to make a decision. Known as decision paralysis, a higher than normal congestion percentage or busy planogram is one such cause.
The Product Performance Report
The next report that can help you understand the impact of space management decisions is the Product Performance Report.
This report works out the projected sales for a new planogram versus your old one. How? It considers the percentage facings change while taking into account the elastic nature of increasing the facings of any given product.
Just because you increase facings for a product doesn’t mean you’ll directly increase your sales based on the facing change. In reality, this is more of an elastic effect that increasing facing should bring your sales up but this is not directly proportional.
Besides the above, the Product Performance Report also allows you to assess the loss of sales when you reduce your product facings as well as when you remove products altogether. Thus, before you publish and roll out a new planogram, you’ll know what impact it will have on the category and your business.
If you have increased facings and the data doesn’t support it, the report will inform you. Of course, it’s not just about identifying mistakes around over facing a product. It can also recognise when you could lose sales because you have under faced a product.
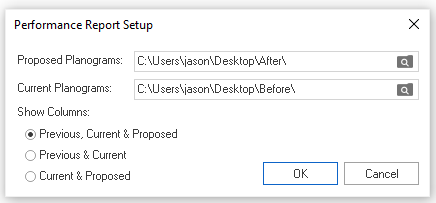
When setting up this report, you can set up a summary, by brand or by sub-category. As seen in the image above, you can choose your report to show various columns. You can choose to include between previous, current and proposed data in your report, previous and current or current and proposed, depending on what your needs.
The Cross Merchandising Report
Displaying products from complementary categories together is an effective way of enticing customers to buy more than they intend. When done right, cross-merchandising can also satisfy the needs of your customers.
That’s why it’s a merchandising technique that you should consider, regardless of the size of your store or the products you sell.
Let’s say you stock multiple categories and use cross-merchandising throughout your store. And, instead of opening and searching all of your planograms, you’d like a report that sets it out for you.
In the shape of a simple grid, the cross-merchandising report does that, showing you all cross merchandised SKUs across all categories. More than that, it also provides you with information on the cross merchandised products’ primary category.
With the information at hand, you can understand if a cross merchandised product is in its correct place or if you need to move it. You can also understand what percentage of products are cross merchandised across your business and ensure it lines up with your strategy.
If you’re a retail buyer, the Cross Merchandising Report can help you to forecast and understand where best to merchandise your products for maximum exposure and sales.

The Clustering Report
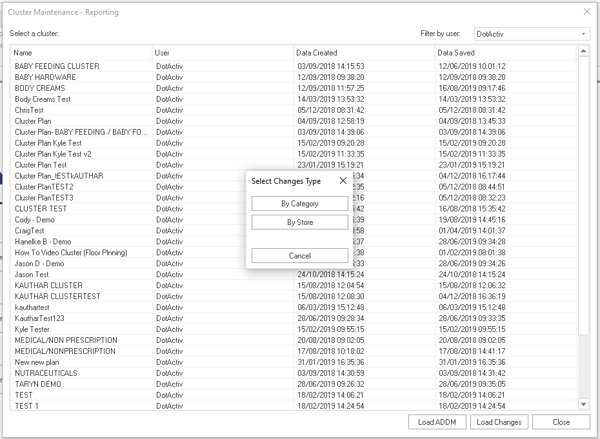
The Clustering Report gives you two different options, depending on your requirements as a retailer.
Firstly, after saving a cluster - but not yet pushing it to live status - you can run a Changes Report as seen below. Running such a report gives you a further two options. You can either view changes by store, or you can view changes by category.
Secondly, you can use the ADDM report. Specific to DotActiv, the ADDM Report allows you to compare your existing shelf plan against a proposed shelf plan. You may recognise it as forming part of the functionality found in the Demand Report as ADDM stands for ‘additional demand’.
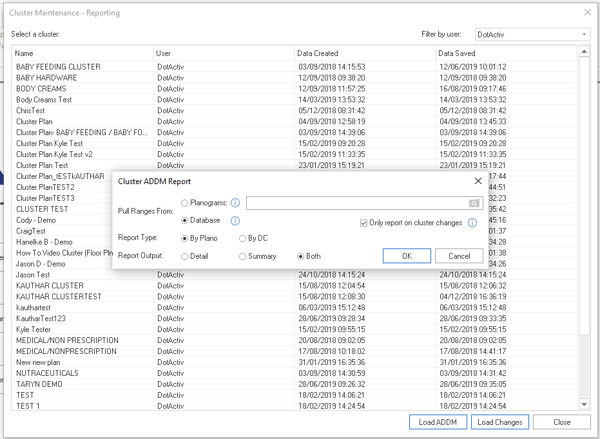
With it, you can pull ranges from your planograms or your database. Similar to the Demand Report, you can choose your report type, be that by planogram or by DC. As seen above, there is a checkbox to only report on cluster changes. Unticking it means you’ll report on all planograms in the cluster plan, regardless of a cluster change. Finally, you can choose a report output between detail, summary or both.
In the context of clustering, the ADDM report works at a higher level, checking which product assortments are affected by your cluster changes. From there, it works out the new stock requirements across each of your new clusters.
It’s an essential part of any efficient reporting toolkit because of one other aspect. You can also use it in conjunction with proposed planograms to give a total ADDM of what your changes would look like and understand the financial impact of any changes at a cluster level.

The Ranging Report
The last but certainly not least report that is a must-have is the Ranging Report.
Selecting it will present you with a Range Optimizer pop-up window where you can select your run. You can also choose to filter by category. After selecting your run, you can choose your format comparison.
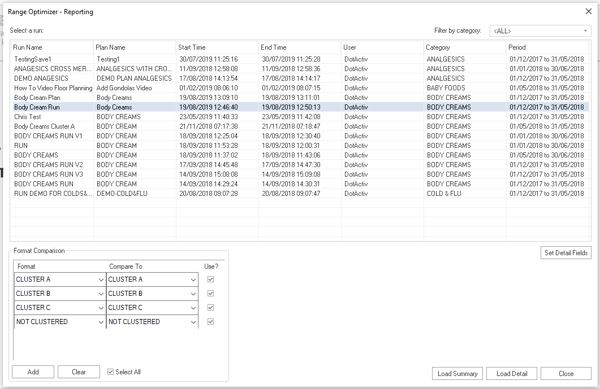
From there, you can choose to a report that provides you with either a summary or detailed account of the changes you make to your range or assortment, depending on your requirements.
Similar to the Clustering report, you can save a proposed range and before pushing it live, compare it to your current range to see the differences.
That makes it an essential report if you want to make bulk changes. In using it to make mass changes, it can safeguard you against any unnecessary mistakes. It offers you insight into your changes before you implement them to ensure your decisions are sound.
What’s more, this report ensures you can maintain consistency at a high-level view while increasing your efficiency and reducing your workload.
Conclusion
DotActiv Lite, Pro, and Enterprise are all different versions of our category management software that allows you to drive category performance. DotActiv Pro and Enterprise come standard with access to the Custom Planogram Reporting Functions. You can visit our online store here.
