

If you want to improve your category management efforts, data analysis can help. In truth, it can do more than help - it can take your business to the next level; set you apart from your competition. After all, what is data analysis but a process of inspecting and evaluating your data to discover insights into your business?
Of course, for any data analysis to be effective, it first needs to include various aspects or elements. That's especially if you want to improve your category management efforts. That’s what you’ll find in this article. We unpack a few elements that allow you any analysis on your part to be effective.
Effective data analysis begins with access to multiple data sources
When it comes to effective data analysis, it’s not enough to have one source of data. After all, how can you effectively understand your business from one angle? It’s far better for you to have access to many different sources or angles.
As for which source is best, that’s up for debate. We’ve already pitted databases against Excel sheets and data warehouses against databases in relation to category management.
One thing is certain though - if you want to implement category management in your business, you need specialised software.
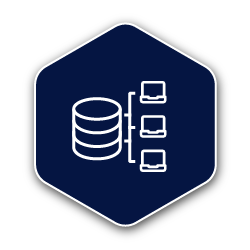
Let’s say DotActiv as an example here. Both DotActiv Pro and DotActiv Enterprise have retail analytics built-in. That means that each come standard with an integrated database so that data flows between your systems and DotActiv.
As for the available data sources, it can be a planogram, a CSV or XLS file, or a database. By inputting your point of sales data in alongside any other available data, you’ll have a better idea of what’s happening in your business.
Of course, this is only the beginning of your analysis. There is far more detail to extracting information and insights from your business.
Building custom dashboards can assist with meaningful data analysis
The fact that you have access to multiple data sources means you can build a category management dashboard suited to your business needs.
What’s more, it can assist with effective data analysis.
How? You’d only need to consider what it is to get the answer.
A category management dashboard acts as a live tool that allows you to track the success (or failure) of your efforts. Want to know if you are increasing your revenue and reducing your inventory holding? A dashboard can provide you with a visual understanding.
Of course, before you can begin building your dashboard or analysing your data, you need to consider the category management process.
Why? Because as part of the process, you need to set up your category management scorecard. It’s a document that helps you to set your goals and understand what you want to achieve at a strategic level.
Let’s say, for example, you want to increase your revenue, improve your margins and reduce your inventory holding. Or, you only want to increase your revenue for now and look to build on that. Either way, you’d need to decide on your strategy first before building your dashboard.
With that information, you’ll know which sales measurements to include. That means you'll have a dashboard that can answer your questions.

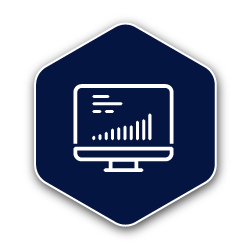
Interactive and visual analytics can help bring your data to life
If you ever find yourself building a dashboard - an action you can take if you use DotActiv software - it’s important to include interactive and visual analytics. Also known as data visualisations.
That’s because of the following point: using data visualisations are best for when you want to find out what’s happening in your business. Yes, you could create a lengthy document and include all your sales data of all of the products you stock in-store. But how long will it take to interpret that information?
In a fast-paced industry such as retail, you can’t waste your time.
Meanwhile, with the correct data visualisations, you can identify trends quickly and easily. You can also interact directly with your data by using different graph types. What’s more, you can use data visualisations to understand complex data and identify where to make improvements.
Of course, you do need to choose the data visualisations that will answer your specific questions. Not every graph will apply to the question you want answered. Fortunately, with DotActiv, you have access to a vast array of graphs and charts that can help you answer any questions about your business. You can also custom these graphs however which way you want.
Let’s say, for example, you want to know how a specific category performs over time. In that case, you could choose a double bar graph to compare periods.
As you build the graph, you can choose a colour theme, a gradient type, decide to display names and data labels and where you want to position them. You can choose to display a legend and whether your label content is a value, per cent or value and per cent.
It’s the same if you’d rather use a pie, funnel or line chart to help you understand your retail data. Every part of your data visualisation is customisable.
Use category reviews to analyse and understand your retail data
If you want to analyse the performance of any category within your store (or across your business), a category review is critical.
A category review is a strategic, ongoing and analytical process of evaluating a category. Its purpose is to improve your sales and the overall efficiency of a category by considering your retail data.
What’s important to note here is that this form of data analysis is not only to your benefit as a retailer. Your suppliers can also benefit from completing a review. In reality, it can lead to a stronger retailer-supplier relationship.
That’s because after completing a review, your suppliers can present their findings to you alongside suggestions on how to improve the category they supply.
Let’s say, for example, a supplier wants to complete a category review. In that case, they’d need to gather any line-item sales data for analysis from you. Since suppliers usually provide products to more than one retailer, they’re likely to have market data that you can’t access easily. They’s take your retail data and compare it to market data.
They could also add shopper marketing data and create data visualisations that answer questions about your business.
Then, with the data collected, and having analysed it, a supplier could offer you information on which products deserve more space, whether there are any trends that you could capitalise on, and whether or not you should discontinue or replace an item.

Sharing your data analysis insights with your colleagues
Once you have created a category review, the next logical step is to present your findings to your team.
With DotActiv, you have the ability to present your data in an interactive presenter view. Alternatively, you can share your dashboards with other DotActiv users.
To share your template, first, download it in DotActiv Report Temple (DRT) format and save it. Then, send the presentation off to a colleague. They would need to open the file in DotActiv to view it. They can open a report the same way they would open a shelf or floor plan that you shared with them. Once in DotActiv, click on File - Open - Custom Report.
After opening, your colleagues can either edit the template or create a report. If you’d prefer to present the report before sending it to your colleagues, after saving and reopening it, click on create report. Once done, you can use the interactive presenter view mentioned above.
As for how this helps you to improve your category management efforts, you only need to consider the benefit of sharing information.
By being transparent and giving access to your findings, you can encourage communication. What’s more, you can align the thinking of everyone who needs to be involved so that when the time comes to implement the plan, it is that much easier.
Conclusion
DotActiv Professional and Enterprise come standard with our Advanced Reporting Functions which can be used to create striking data visualisations. You can get a 14-day trial of DotActiv Professional or Enterprise on our online store here.
