

In an era of exponentially increasing consumer expectations, your profitability and survival as a retailer depends upon specialist tools and software. In this instance, we're referring to category management software, which allows you to cluster your stores and categories. When you get your clustering right, you can provide your customers with the products they want no matter which of your stores they visit.
That's only one reason why clustering and completing a cluster analysis exercise is worth it. Here's another reason: when you get it right, it improves your reputation. Which retailer wouldn't want to compete for and win the attention of shoppers? Boosting your standing as the go-to store for a product or category means you can build your reputation until you become synonymous with quality.
But how? How do you complete a clustering for your retail business? More importantly, what do you need in place to run one successfully? The answers to all of these questions lie with DotActiv. Whether through our cluster optimization service or various clustering tools and features in our proprietary software, we have a solution for your needs and situation.

What is cluster analysis?
Before we answer how we help you complete your clusters, it's critical to set the scene by understanding cluster analysis and its purpose.
In short, as depicted above, it comes down to grouping specific data sets and transforming them into information you can use.
As for its purpose, it's to implement cluster segmentation. That allows you to group your customers according to similar purchasing behavior. You can use various clustering techniques to develop similar groups of consumers who vary across shopper behavior, needs, wants, demographics, and more.
You can also use store-related factors such as geographic location and available shelf space and price-related factors like price, brand, flavor, and more for clustering. As a retailer, cluster analysis allows you to describe and target the main shopper segment per segment, as explained in the below examples:
Family feeders
These consumers complete regular shopping trips for their families. Their basket composition may change over time due to the preferences of the end-users of the items. They are drawn to products from brand leaders and those on frequent promotions.
Convenience shoppers
These consumers have busy schedules and regularly purchase ready-to-eat and convenience foods. They shop at many retail stores and are more likely to shop online.
Variety seekers
These consumers complete regular shopping trips for their families. Their basket composition may change over time due to the preferences of the end-users of the items. Products from brand leaders and those on frequent promotions draw them in.

Why should you analyze your clusters?
Cluster analysis is necessary if you're looking to understand your customer and what drives their purchasing decisions. Of course, that's not the only advantage. The data analysis generated from cluster development also aids you in strategic decision-making, which impacts all facets of your business.
It increases the accuracy of your demand forecasting data
You can analyze your data to predict the purchasing patterns and sales and unit movement of stores within the same cluster.
It assists you with your assortment planning efforts
You can tailor your product ranges to the dominant consumer segments that shop in a particular category, which leads to increased sales, unit movement, and customer satisfaction.
It leads to increased customer satisfaction and loyalty
By personalizing the shopping experience, you can increase customer satisfaction, encouraging impulsive and unplanned purchases while motivating shoppers to return to your stores.
If we unpack the advantages, it's worth unpacking the consequences of not analyzing your clusters.
You'll create a generalized shopper offering
Without implementing cluster analysis and consumer segmentation, you'll end up with a generic product assortment offering that fails to provide a tailored shopping experience to your customers.
Your customer segmentation isn't based on data
You can't expect to yield reliable or accurate results when you don't base your customer segmentation on consumer, store, and product-related data.
You don't monitor segments over time
When you don't measure cluster performance over time, you can't measure improvements in shopper satisfaction, profits, and customer loyalty. Your clustering must accommodate changes in purchasing patterns and product trends.

How do you approach cluster analysis in DotActiv?
1. Building category-based clusters in DotActiv
At DotActiv, both clustering and assortment planning links in our software and service offerings. Once you have optimized, analyzed, and profiled your clusters, you must use these insights to create a customer-centric or personalized assortment plan for each cluster.
You can use category-based clustering to guide the assortment planning process and place cluster-specific ranges onto planograms and later floor plans to assist you with space optimization. By identifying your clusters per product category, you can select the right products for your assortment due to an in-depth understanding of the target market.
Creating planograms is optimized as you do not need to build store-specific planograms, and you can give those products favored by the target market more shelf space and eye-level facings. Consumer demand and concrete sales data rather than subjective guesses influence space allocation.
To create cluster-specific planograms, run the clustering and assortment initializer to set up your category.
Once complete, you can use the cluster maintenance feature to set up your cluster plan.
From there, it's time to use the cluster optimizer feature to create customer-centric clusters.
You can use clustering to respond to consumer behavior changes. Category-based clustering allows the different functions of category management to work together and avoid the one-size-fits-all approach to targeting customers.
The data analysis generated from this approach aids in assortment planning by providing various clustering approaches based on the insights gained from cluster analysis.
These clustering approaches include:
One Size Fits All
Stores with a specific category receive the same product range. This method boosts economies of scale and saves time in creating product ranges. However, this does not account for different consumer profiles and subsequent consumer behavior across store branches, resulting in an unoptimized product range for the store or target market.
Top-Down
This approach focuses on store-specific factors such as demographics to place categories per store into manageable clusters. You can understand the consumer behavior of your target market without requiring sales data. However, you may miss the opportunity of recognizing customer trends and purchasing patterns.
Bottom-Up
Here, you'd group stores according to consumer demands per category. This technique uses sales and demand forecast data at a stock-keeping unit (SKU) level. You would also consider product attributes such as brand, pack size, and price. This approach provides insights into the consumer decision-making process and preferences per category. Once you have identified your clusters, you can create shopper profiles to provide insight into customer preferences.
Store-Specific
This approach treats each store as its own cluster with individual buying responsibilities. It's a labor and time-intensive method and does not facilitate beneficial price negotiations for retailers. Brand identity is also lost as customers cannot know what to expect in each branch of their chosen retailer.
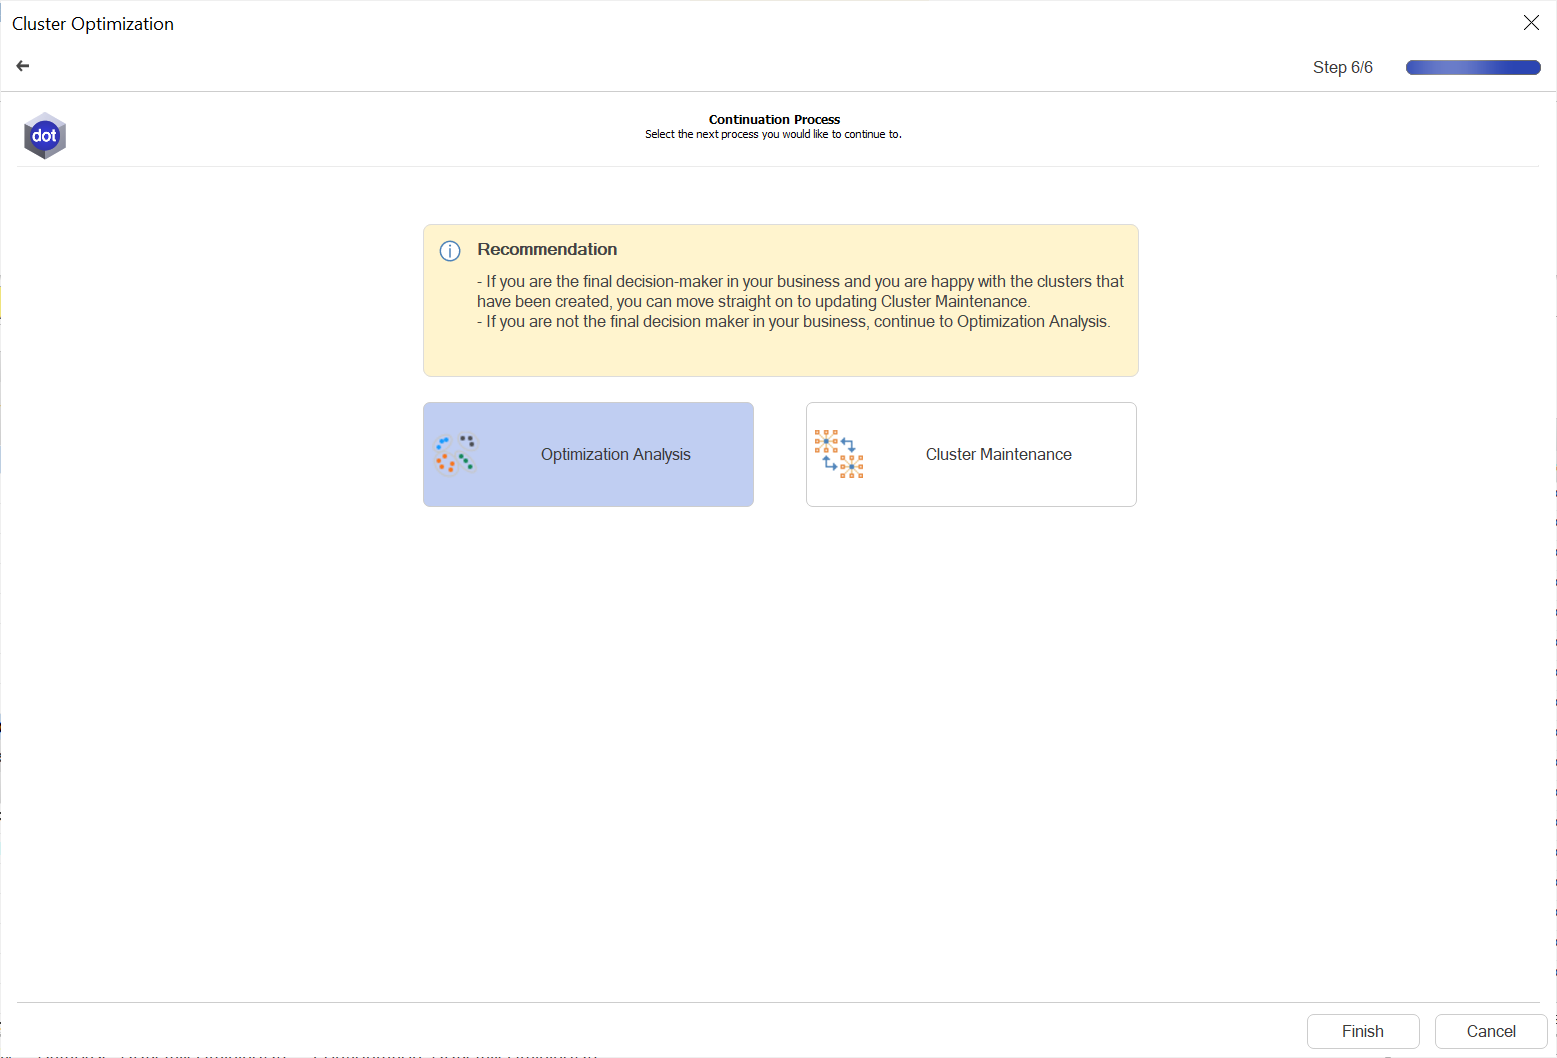
You would use DotActiv's cluster optimizer feature to create customer-centric planograms. You can analyze your data further or go straight to cluster maintenance. We recommend you analyze your data as this is where you make decisions and analyze trends within the clusters.
From there, you can update your database to create customer-centric assortment plans and planograms for your chosen product category.
The process results in increased turnover, customer satisfaction, lower inventory costs, and an improved in-store experience.
We also have two different types of integration, one-way and two-way, the second of which we recommend if you plan to use DotActiv to set up clusters for your retail business.
We have one-way integration, which we use to import retail data from your data source (Sales Database, ERP, SAP, etc) into the DotActiv database structure hosted on a SQL server. We import this data in a specific format based on staging tables. Doing so allows users to analyze, report, range, cluster, create floor plans and planograms, and use all the DotActiv software features.
On the other hand, two-way integration includes all of the steps mentioned above. But, instead of feeding data back into the DotActiv database, the causal data, with value-added from planogram generation, ranging, and clustering, is scripted back into the database and exported through Export Staging Tables.
The information in the Export Staging Tables feeds into your replenishment cycles. It could include ranging information, product status information, updated or corrected values for any of the feeds, stock information for replenishment engines, or additional values calculated on our side per your wishes.
We can export these for you to receive and ingest into the original systems on your side.
A two-way integration also allows the idea of store communication to be brought into the conversation.
A one-way integration is a gateway into an automated system that eliminates human intervention when communicating data from the client into the DotActiv database. However, for the cycle to be automated and completed, you need a two-way integration since it ensures that all necessary information is communicated back to you as simply and efficiently as possible.
2. Diagnosing clustering problems with DotActiv software
You can implement clustering manually or automatically. Due to the large amounts of data you need to utilize when creating clusters, we have the Cluster Optimizer feature within the DotActiv software. This feature uses unsupervised machine learning to find similarities in category data and group stores efficiently. The algorithm calculates the ideal number of clusters and decides which stores to locate in each cluster for a particular product category.
By using an algorithm to optimize your clusters, the DotActiv software can test all possible cluster variations and recommend the best one for the product category.
Clustering helps you by providing valuable insights and enabling you to make informed decisions regarding store locations, product assortments, and targeted marketing strategies.
By analyzing customer data and identifying patterns, clustering helps you group similar customers based on demographics, purchasing behavior, or preferences. This allows you to create tailored marketing campaigns, optimize product placements, and customize their offerings to specific customer segments.
Clustering also aids in identifying untapped market opportunities, optimizing inventory management, and improving overall customer satisfaction and loyalty.
But how can you tell if a clustering problem exists?
For that, you have the Cluster Plan Delivery Report.
Store Composition per Cluster indicates the percentage of stores that make up all the clusters. This is the first graph that can tell you whether or not you should cluster. If one specific cluster makes up most of the stores, it might indicate that clustering isn’t necessary. If there is a more evenly split of the stores between clusters, there is a good reason to cluster.
Sales Display Hierarchy Contribution per Cluster indicates which clusters spend more money on specific sub-categories. You can click on a sub-category to drill into it and gain more information on spending habits at a segment level. If the sub-category level didn’t show differences between the clusters, drilling into the segment level might show the differences.
Units Display Hierarchy Contribution per Cluster indicates how your different clusters shop in terms of the quantities they buy. As with the previous graph, you can drill into the sub-categories to see the difference in units purchased in your different clusters and see if there are any trends. It is more likely to be evenly spread if you cluster based on LSM, and more likely to be different if you cluster based on store size.
If you cluster based on LSM, Store Profile Composition per Cluster is a useful graph to determine your clusters. It indicates which stores (based on profile) fall in your specific clusters and if there is a clear difference in-store profile among clusters. It can assist you in deciding to cluster a category where the Average Linkage isn’t high, but you can see a difference in consumer habits based on store profile.
Lastly, Brand Profile Composition per Cluster assists you to analyze the different brand profiles in each cluster. If you drill into every brand profile, you can see what brands form part of this specific brand profile, and how much each cluster prefers this brand. You can analyze the sales, quantity, and gross profit of each brand in each cluster. This graph is also critical when ranging, as it assists you in seeing if you should remove brands from a range in a specific cluster.
After analyzing all the graphs mentioned above, along with the Silhouette Coefficient and Linkage Distance, you can determine if it is necessary to cluster a category.
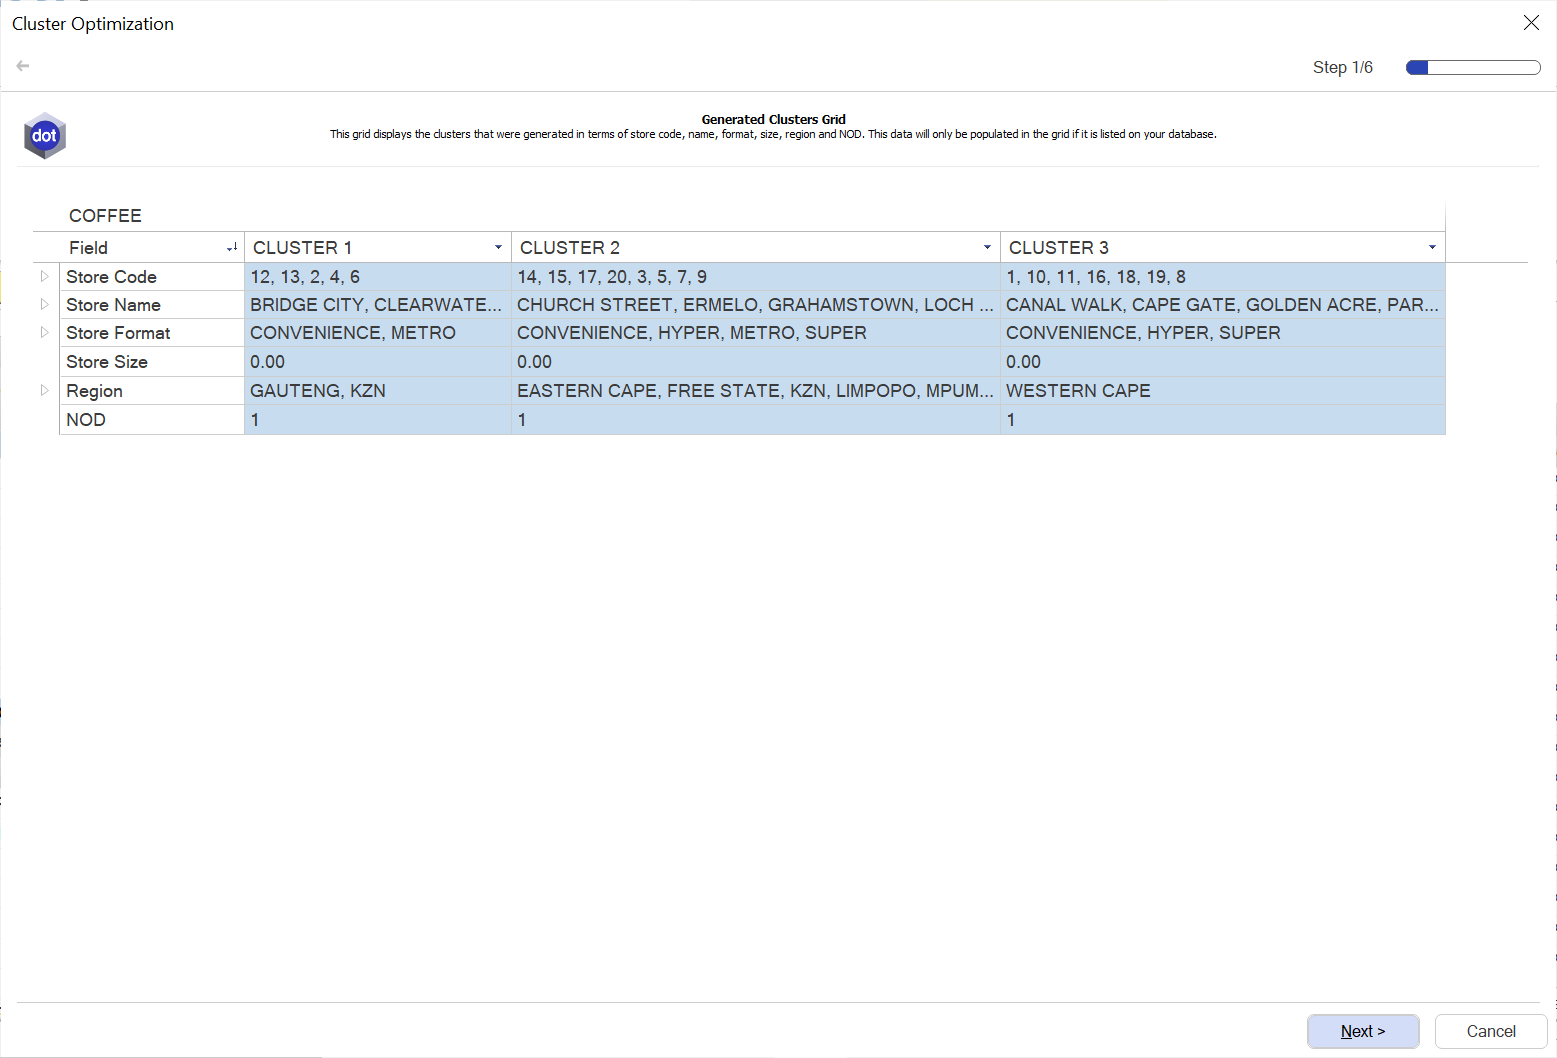
To best implement this software function, the first set is to look at the generated clusters grid.
It's critical to note the number of clusters it has suggested you follow by checking the number of stores it has put into each cluster. This eliminates the possibility of having a cluster for a small number of stores. You can then look at your store sizes within the clusters to assess the profiles of the store that ties in with the region. The ability to see which stores in a specific region fall into which clusters allows you to classify them as premium, mid-tier, economy, or low-economy stores.
Lastly, the generated clusters grid also provides the NOD suggested per cluster, allowing you to pre-analyze the planograms you will need to build or assign to that specific cluster.
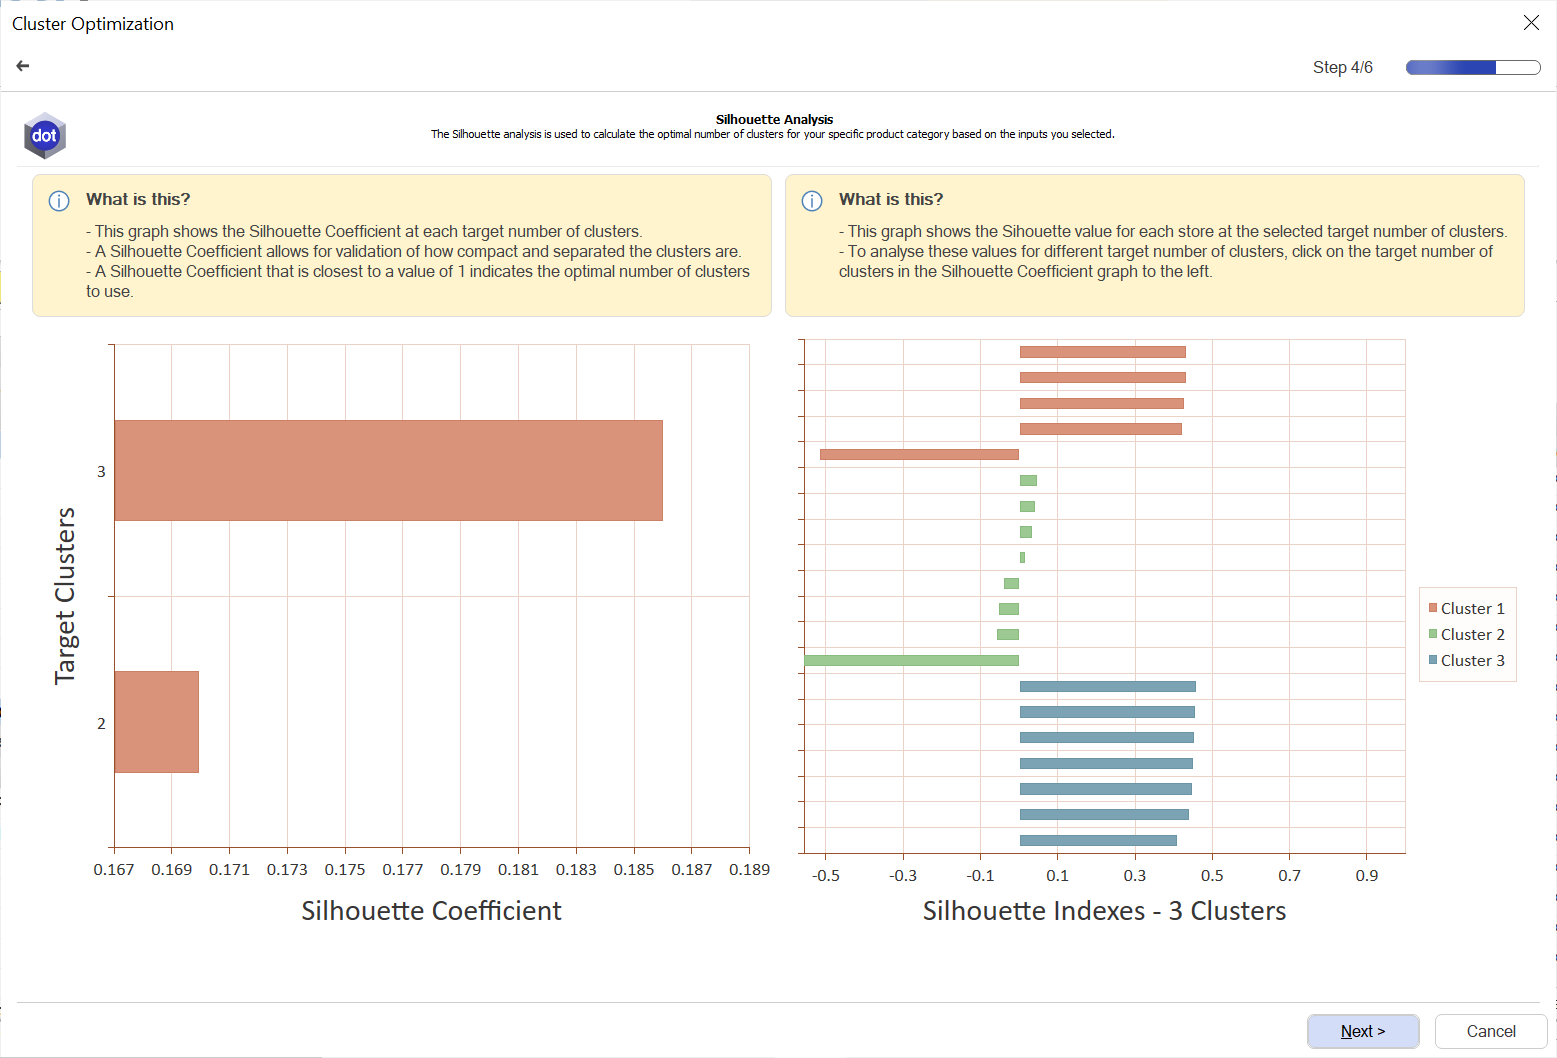
Then there is the silhouette coefficient, a method used to help validate the consistency between clusters and how compact they are. With the graph, you can determine the number of clusters that will best suit the category, the range, and shopping behaviors.
The score ranges between -1 and 1, where the optimum number of clusters is. The bar closest to 1 is the most optimal.
A score of 1 means the clusters are separated from each other and have definite differences.
A score of 0 or negative means there are similarities with no distinct consumer preferences. It means that you should use manual intervention to cluster or not.
The linkage distance determines the significance of the differences between the pre-determined clusters as established by the DotActiv software. DotActiv stipulates that the first sign of the need for clustering is that the average metric has a greater than 16% difference. At DotActiv, we use 16% because it is considered the point of significance and is where the clusters are diverse enough for clustering to be worth your time and effort.
Here you compare the various linkage distances between the cluster combinations and determine if there is a significant enough difference to recommend clustering. Comparisons between the suggested clusters can be made by selecting alternative clusters to compare from the drop-down list. For example, comparing clusters 1 and 2; 2 and 3; and 3 and 1. The various metrics are calculated by the software and displayed below the cluster comparisons.
Ensure you compare all the suggested clusters with one another as there may be instances where the percentage linkage distances might indicate that clusters are so similar that combining them might be more effective and efficient than attempting to separate them.
With these metrics, the software measures the physical distance between two stores (also called points) within the cluster being compared based on the type of metric used. The larger the percentage between clusters, the more significant the distance, and thus, the more diverse the clusters are, suggesting a greater need for clustering.
Let’s consider what each type of linkage distance metric measures:
Single linkage distance
Because this metric compares the two closest points (stores) between clusters, one would expect that this metric has the smallest percentage compared to the other three. This is represented by the green arrow in the below diagram.
Complete linkage distance
This is defined as the distance between the two most remote/outlier points (stores) among the two compared clusters. Usually, one would expect this distance to be the greatest percentage difference compared to the other three metrics as it equates to the furthest points. This is represented by the red arrow below.
Average linkage distance
This is determined by taking the average of each cluster’s stores and comparing that to the average of another cluster’s stores – hence it is the average of the compared clusters. This is represented by the blue arrow in the below diagram.
Medoid linkage distance
This is determined as the central point of each cluster’s stores and is compared with another cluster’s central point. This is represented by the orange arrow below.

Using the clustering function in DotActiv software can be measured in a few ways:
- If the clusters created are clear and match the intended goals, the analysis has served its purpose.
- If the insights gained from the clusters help make useful plans and improve decision-making, it means that the analysis was successful.
- If the strategies implemented based on the cluster analysis result in positive outcomes like more sales, happier customers, or better product placement, it confirms the success of the analysis.
By regularly assessing and improving the clustering approach using these measures, you can continue to achieve success with DotActiv's clustering function.
3. Delivering impact with DotActiv's Cluster Optimization service
We develop category-based clusters informed by a deep understanding of the interdependent nature of category management. The result is an improved ability to tailor your categories to local shoppers' needs and use your business resources more efficiently.
Our consultants provide you with performance and category-based clustering insights, an analysis of any current clusters, and help you profile any clusters to leverage the information to your benefit.
You stay in control throughout while we do everything from providing insights around maintaining and storing clusters to organizing clusters according to unique demographics and guiding you through the clustering process.
Service clients have access to our Reporting Templates and can use these reports makes a significant difference when analyzing and interpreting clusters.
So who makes the ideal customer?
You're the ideal customer if you're seeking to analyze large amounts of data effectively, understand your target market within and between clusters, or improve the efficiency of your assortment planning and planogram development processes.
You can begin clustering when you identify stores with similar consumer behavior and purchasing patterns. However, we recommend you only begin clustering once you have more than 15 stores. At this point, creating store-specific assortment and shelf plans becomes impractical and a mass-market approach becomes too generic.
But what about common pitfalls that could prevent you from clustering?
Time-consuming
The process of setting up your cluster analysis inputs can be a time-consuming process with unnecessary and irrelevant human intervention.
Insufficiency
Missing lines or unclassified data indicates that your hierarchy is incomplete and out of date. This automatically means that the information on planograms and floor plans is inaccurate.
Data collection
Incorrect data will result in incorrect assortments and inaccurate planograms.
When using the clustering tool in the DotActiv software, you must ensure that the category format and the category number of drops are correct.
Clustering makes good business sense because it is a great way to maintain consistency at a high-level view, while simultaneously increasing efficiency through reduced workload. It is far easier to maintain clusters than it is to maintain individual stores or categories. It also creates similar profiled stores to have similar or the same ranges.
The floor plans created using the DotActiv software directly influence the planograms which you create using the product assortment of the category. Therefore, category-based clustering has a direct influence on the floor planning process.
Once you create your clusters using the Cluster Maintenance feature, you can link the applicable planograms to the floor plan using the Key Market Field (Store Code).
You must first create a cluster plan to have a floor plan that is linked to the product assortment and planograms for the store. This process facilitates sales data analysis for you to make strategic changes to the product assortment, planograms, and floor plans.
Category-based clustering is a recommended activity for any retailer as this benefits both the assortment planning and floor planning processes.

Conclusion
Using DotActiv’s all-in-one software, you are able to create, edit and maintain the clusters per category to ensure that your clusters stay up to date with the changing consumer market and retail industry.
Let DotActiv remove the uncertainty around clustering and tailor your categories so you can become known as the store where shoppers can find what they want.
To discuss your unique requirements and how our cluster optimization software and services can help you, book a complimentary meeting with a DotActiv expert here. You can also browse our software and service options on our online store here.
