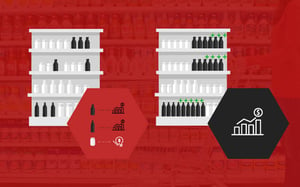
A category analysis is not simply a tool you can use to show how your category is performing. In the hands of a supplier, it can also be used to negotiate more shelf space for a brand. How? The cost of shelf space is a premium. It must deliver profit. So retailers must always allocate space to produce the highest return.
But how do retailers decide which products these will be? That's where your suppliers come in. They can offer expertise regarding a category. And the best way to do that is by using data. More specifically, it’s the data that comes from a category analysis.

Having the right facts with you
As a supplier, your goal during any negotiation for more shelf space should be to show how your brand can improve the retailer’s bottom line. In fact, it should be your primary goal. Not much else should matter.
However, in our world, where statements can be made about how great a product is, it’s easy to hide away when any predictions don’t go according to plan or promises are broken. Words then lose their meaning. That’s not the case when making a statement based on data, though. Data doesn’t lie. It can’t.
Imagine attempting to negotiate for more space for your brand or product without data at your disposal. That is sheer madness. You could easily end up losing face with the retailer rather than strengthening any relationship that you might have built up with them up to that point.
In using data obtained from a category analysis, you have the facts in black and white. If you make a statement about how great your product is, it’s not just you talking your brand up. The data will back you up.
And it’s not just a general overview of the category that we’re talking about either. You can drill all the way down to view brand performance and even line item detail should you want to. That means you can show retailers exactly which products are performing and which aren’t. You can also compare sales against units, and units against your gross margin. Everything about a category can be analysed.
You can also get an indication of how a category is performing over time. That includes comparing your sales and/or units sold year by year, by month, or even by week or day.
If you’re interested in performing a category analysis, we recommend you read our previous blog, where we touch on the different types of data visualisations you need to include in your analysis.

Your suggestion needs to make sense to the whole category
When the time comes for you to negotiate for more shelf space, it’s important that your credentials around the category are at their peak. That means you need to be in a position of strength before you consider talking to a retailer about possible changes.
Of course, if you’re a supplier worth your salt, you’ll likely be talking to your retailer on an ongoing basis anyway. Constant dialogue is key if you want to build and maintain a good retailer-supplier relationship. If you are, you’ll also have intimate knowledge of how stressful a category review can be. After all, you’re taking an in-depth look at your category and you might not know (or like) what you’ll find. But with data, you’ll be better prepared and that uncertainty and stress disappears.
That doesn’t mean that you can relax though. There is still a lot of work to be done. Remember, the buyer or category manager at the retailer is not interested in your self promotion. They’re rather interested in what you can do to improve the overall performance of their categories. If you can speak to that, you’ll have their ear.
That's why data is so important. As mentioned earlier in this piece, it has the power to persuade. Through your category analysis, you can demonstrate that taking space away from a competitor’s product and giving more space to your product is in the best interests of the category. A retailer won’t be able to argue against that.
Let’s take Product A as an example. It’s known for selling a large amount of stock each month. It could be one of the best performers for the retailer. The data obtained through a category analysis can confirm that. However, the data can also indicate that while it’s selling a large amount each month, its sales have stagnated. It could even be going into a slow decline.
And then there is Product B, which happens to be yours, and the data shows that sales are increasing steadily. In fact, they’ve been increasing for the past few months while Product A’s sales have been in decline. With that information, a suggestion to allocate more space to your product makes complete sense to the whole category.


