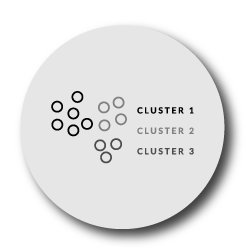
Cluster analysis is a technique used in machine learning which groups data points together based on the similarities between them. You can use various clustering algorithms which provide valuable insights about your business. The information generated from clustering can be used across your business functions to create a profitable consumer response. But which clustering algorithm is right for your business, target market and products?
What are clustering algorithms?
You can use clustering algorithms to identify previously undiscovered patterns within a data set. An algorithm can either be supervised or unsupervised. You’d use a supervised clustering algorithm when you specify the input variables of the clustering exercise as well as the output variables. Unsupervised clustering is when no clear output variables are required and the algorithm is independently able to detect patterns and similarities within the dataset.
In this article, the practical use of clustering algorithms within the retail industry is discussed along with an assessment of each model. This will help you make the decision of which algorithm is right for your business.

How are clustering algorithms used for retail clustering?
When selecting a clustering algorithm, you need to consider the goals and objectives of your organisation. The access to and type of data available plays a significant role in this decision. The type of data, size of the datasets and cleanliness of the data will affect the type of algorithm suited to your business needs.
Once you select an algorithm, you can choose a clustering method which will help you to tailor your assortment plan to the target market.
The clustering model you select must be able to process large amounts of data quickly and effectively. The most commonly used algorithms for retail applications are partition-based and hierarchical clustering. However, you need to determine the most accurate algorithm and clustering method for your specific product category or business problem.
To obtain useful and meaningful results, you should select a clustering algorithm tailored to the market environment in which your business operates. This will help you to understand the information and insights generated from the cluster analysis.
As a retailer or supplier, you can use clustering to understand who your customer is and what drives their purchase decisions. This will help you to tailor your product offering and marketing strategies to your target market to increase the overall ROI of your business.

Which clustering algorithm is right for you?
1.Partition-based clustering
A partition-based clustering algorithm is an unsupervised approach that you’d use to group data points around a centre point called a centroid. Partition-based clustering segments the groups based on the distance between the data points and classifies these into a specified number of clusters.
It’s worth noting that each data point can only belong to one cluster at a time. A partitioning algorithm makes an initial grouping of the data points while, after this, it performs iterations/reallocations based on the mean or median data points of the set until it reaches the final groupings.
K-means clustering is an example of a commonly-used partitioning algorithm because it is simple, efficient and flexible. When using this algorithm, you will need to select the number of clusters (k) that you would like to use.
To determine the optimal number of clusters for your business, you can use either the Elbow method or industry-related knowledge for the specific product category.
After the k-means algorithm runs, each data point is allocated to the nearest centroid so that there is a large enough distance between data points from different clusters. The algorithm performs iterations until an average (mean) is achieved and the data points are assigned to their final clusters.
This type of algorithm is suitable for use when you have categorical data (e.g. grouping based on category, subcategory and brand). For example, you could use this information to group brands by units movement across all of your store branches to assist your buyers with the assortment planning process.
The k-means algorithm is highly scalable, simple to use and has a faster run speed than hierarchical clustering. It is able to process large data sets that are required for retail POS and loyalty data and produces compact and clearly defined clusters that are well separated.
However, you would need to specify the number of clusters required which, if not done correctly, can be troublesome for your business. The algorithm may also be inaccurate at times when you detect outliers in a data set.
2. Hierarchical clustering
A hierarchical clustering algorithm is an unsupervised approach that groups data points into a hierarchical tree called a dendrogram. You have the option to choose the numbers of clusters you want to create. This specifies the distance between clusters and the distinctions which you’d use to group them. As the value of k increases, the accuracy of the hierarchical clustering algorithm improves.
It’s best to use a hierarchical algorithm when you have a random dataset. This algorithm has applications in classification as well as research and development. You can classify products into a category hierarchy using a hierarchical algorithm which specifies the department, category, subcategory, segment and so on.
A hierarchical algorithm can also be used to track the progress of research and development in a similar manner to a decision tree. As new products are created and added to a category, they are represented on the dendrogram.
This algorithm is easy to use because there is no need for you to select the number of clusters you require. The algorithm also produces a clear graphical representation of the clusters so it’s easy to understand and interpret. However, you could face challenges when you try to interpret the cluster descriptors or criteria.
Agglomerative and divisive clustering algorithms are two types of hierarchical clustering that you can use to group a data set. Various criteria can be used to group or separate the data points.
An agglomerative approach is a bottom-up algorithm that starts at the bottom of the hierarchy and begins with each data point. The algorithm groups data points that are close to each other until all the data points are classified within the hierarchy.
A divisive approach is a bottom-down algorithm that starts at the top of the hierarchy and begins with all the data points. The algorithm further separates data points into smaller clusters until each point falls within a single cluster.
3. Fuzzy clustering
Fuzzy clustering is an unsupervised approach also known as soft clustering or soft k-means clustering. This algorithm allows each data point to belong to more than one cluster. Each data point belongs to a cluster due to a weighting of 0-1. This algorithm is similar to the k-means algorithm because you are required to choose the number of clusters you would like to create. The algorithm also reiterates until a final grouping is achieved.
You can use fuzzy clustering for marketing applications. You can segment consumers into clusters according to their needs, wants, purchasing patterns, LSM and psychographic-profiles. This algorithm may be useful to you because it provides information that can help you to interpret the clusters produced. It is also a flexible algorithm that can be used for various applications.
Fuzzy clustering allows data points to fall within more than one cluster. This is a more natural representation of consumer behaviour and can, therefore, give retailers who use this approach a competitive advantage through the understanding of dynamic consumer behaviour.
However, some downsides to this algorithm are that you will need to select the number of clusters you would like created as well as a cutoff value for membership to the groupings. This algorithm is also sensitive to the original placement of the centroids.
4. Density-based clustering
A density-based clustering algorithm is an unsupervised approach that you can use to create clusters based on the density of data points within an axis or region. After the algorithm runs, each cluster gets an area of a specified radius that must contain a minimum number of data points in order to form groups.
You can use this algorithm for various applications. It is able to analyse data and make predictions. For example, you can cluster and analyse shopper basket composition to predict which products the consumer is likely to buy on their next shopping trip. Products that are frequently purchased together will fall within the same cluster. You can then use this information to make personalised offers to the consumer.
Using a density-based clustering algorithm is beneficial because it can identify arbitrarily shaped clusters. It is also able to handle noise and outliers efficiently. However, it is highly sensitive to the input parameters selection and may product poor cluster descriptors. It is also unsuitable for high dimensional datasets such as product attribute information.
One of the most common density-based clustering algorithms is called the Density-Based Spatial Clustering of Applications with Noise (DBSCAN) algorithm. This algorithm discovers and grows areas of high density into defined clusters and noise.
When a data set is plotted on an axis, noise is referred to as the data points that fall just outside the line of best fit. The presence of noise is expected with an unstructured data set. However, too much noise can disrupt the clustering algorithm and make it difficult for it to detect clearly defined clusters.
5. Grid-based clustering
A Grid-based clustering algorithm first groups the data points into a grid-like structure within which the clustering will take place. The algorithm allocates data points and measures the density of each cell. This algorithm uses a multiresolution grid data structure. This means that the algorithm quantifies the grid space into a finite number of cells within which the clustering exercise can occur.
The complexity of the clusters depends on the number of grid cells that are populated and not the number of data points in the set.
The two most commonly used grid-based clustering algorithms are ‘STING’ and ‘CLIQUE’ which explore and group the statistical information within each cell.
The STING algorithm is called the statistical information grid approach. When you use this algorithm, the grid is divided into rectangular cells. This grid forms a hierarchical structure where different cells correspond to a different resolution. Each cell at a high level is grouped to form the number of cells at the lower levels. The statistical analytics of each cell is calculated, analysed and stored.
This algorithm is beneficial because it does not require you to set up and run the entire algorithm again, only an incremental update is required.
The CLIQUE algorithm is called the clustering in QUEst approach. This approach is density and grid-based that allows for the processing of high dimensional data. This algorithm is beneficial because it has a fast run time. It is also independent of the number of data points which allows it to be used on large data sets.
With this algorithm you can identify clusters of arbitrary shapes and identify any number of clusters with any number of dimensions/variables (these could be sales, units, brands and so on).
Conclusion
There are many more clustering algorithms available with varying benefits and capabilities, that you might want to look into. Each algorithm is best suited to a different business problem and data requirement. Testing the algorithms on your datasets might be helpful in deciding which is right for you.
Looking for assistance when choosing a clustering algorithm for your business? Let DotActiv help. Find out more about our clustering services or book a meeting here.


