


Data visualisations can be described as the representation of information in the form of charts, diagrams or pictures. They are also a powerful way to communicate and share ideas and report on data metrics. Why? Because individuals process data visualisations faster than large data sets. As a result, you can identify any trends and insights quickly and easily.
Of course, creating striking data visualisations requires a reliable software application. This is where DotActiv’s all-in-one category management software can help. With DotActiv’s Professional and Enterprise license editions, you have the ability to select specific data to report on, and from there, create custom reports full of striking data visualisations.
What are the benefits of data visualisations?
Identify trends rapidly
There are many benefits to using data visualisations to report on your data.
Firstly, you can identify trends rapidly.
Imagine receiving a 10-page document full of sales data for a list of different products. Reading through this document and identifying significant findings will take time; time which you might not have. However, if this data was represented as a pie chart, for example; you could quickly and easily identify your top-performing products.
Direct interaction
Data visualisations also allow direct interaction with your data. You can manipulate data by using different graph types and grid layouts. This creates far more flexibility compared to a one-dimensional spreadsheet or table which doesn’t allow as much customisation.
Faster Processing
You’ll find that most individuals process visuals much faster than text. Visuals are also easier to remember and analyse than long data lists. For you and your businesses, this means that your teams will have a better understanding of what you expect of them. Also, all instructions will be executed as intended.
Understanding Complex Data
Adding to the point that data visualisations allow individuals to process data faster, using graphs and charts also reduce the complexity associated with large data sets.
There is no doubt that it can be overwhelming to receive a lengthy data list and be told to identify noteworthy findings.
When information is shared using data visualisation tools, complex data can be better understood. Your team will process this data quickly, and will be able to identify business insights without becoming overwhelmed.
Identifying successes or room for improvement
Moreover, you can use data visualisation to identify successes and possible room for improvement.
Sales teams often use data visualisations to identify opportunities to improve when handling deals.
For example, you can create a deal pipeline to identify what the next steps are in the sales process. Your data visualisation will also communicate what went wrong with certain deals. Based on this information, your sales team can refine their sales processes.
Empowering Teams
Finally, data visualisations empower your team to make more informed and better decisions.
The ability to easily analyse data using data visualisation will equip your team to move in the right direction. More importantly, your team will have the confidence to make valuable recommendations based on data visualisations that are easy to process and understand.

Creating data visualisations in DotActiv Software
DotActiv Professional and Enterprise give users access to a number of data visualisation tools, including adding graphs, grids and planograms.
When adding a graph to a custom report, there are many different graph options from which to choose.
Once you have chosen your graph type, you can customise your graph layout by adding labels, changing headings and choosing a theme. The different graph types are illustrated in the GIF below.
As described earlier in this article, presenting a graph to your team will allow them to quickly interpret the data. Your team will immediately be able to identify a trend or insight.
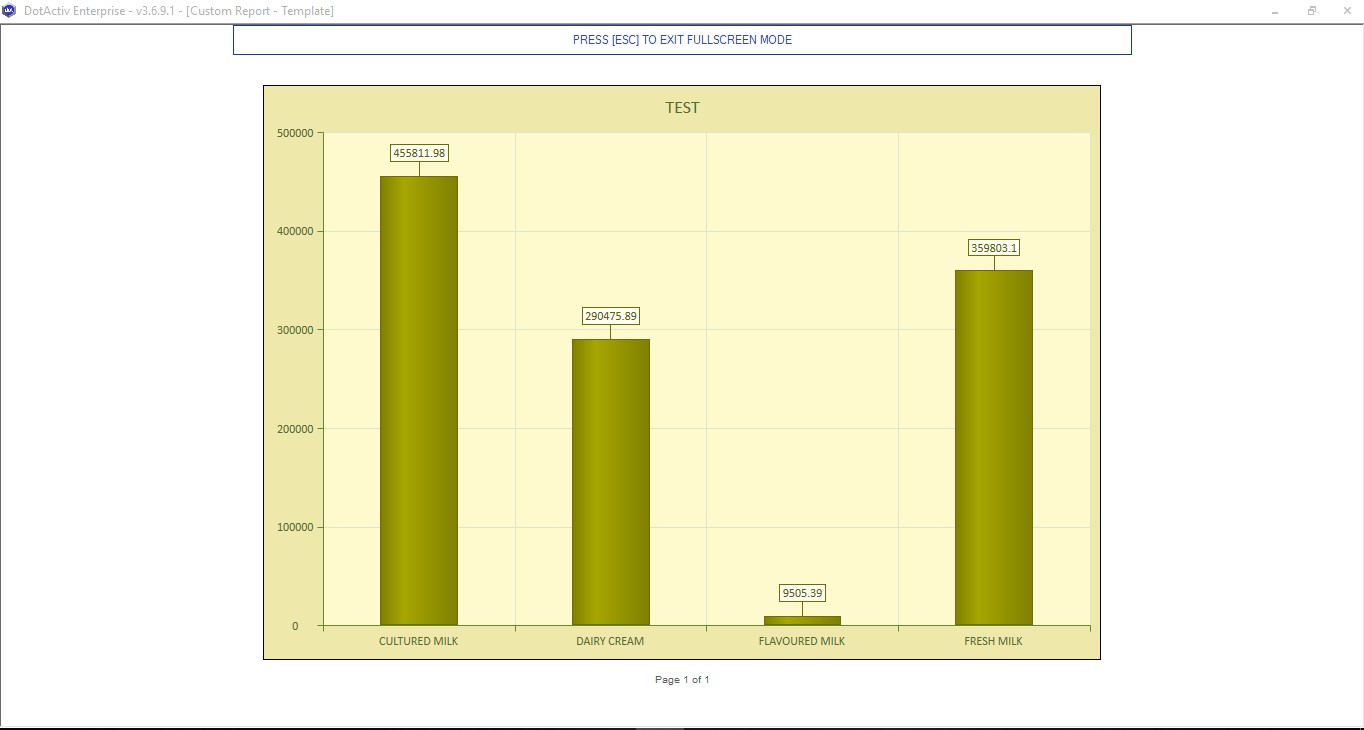
Let’s consider the below image. In it, you can quickly identify that Cultured Milk is performing the best in terms of sales while Flavoured Milk is contributing the least.
Using DotActiv’s Custom Reporting Function, it’s also possible to drill down into graphs to view even more information. In the below example, we have analysed sales by sub category and then drilled down into brand.
Graphs are only one type of data visualisation tool that can be used within DotActiv’s Custom Reporting Function. It’s also possible to add grids to your custom reports.
Grids provide a summary of your product data in a chart format. In the example below, we have analysed the sales of different brands in the Dairy Category.
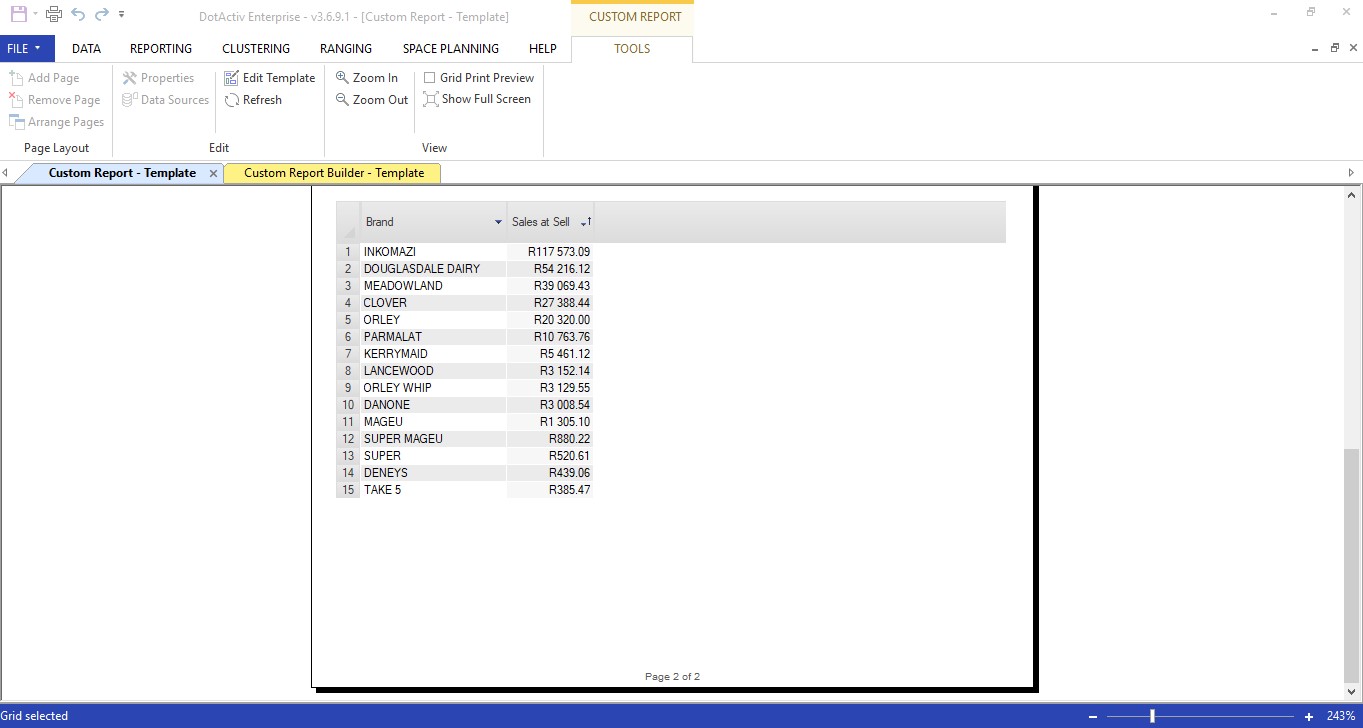
From this grid, you can see a summary of the top performing brands and then start to formulate strategies for the brands that aren’t performing as well. You can also share this grid with your suppliers to indicate why you might not be giving their brands as much space on your planograms.
With DotActiv’s Custom Reporting Function, it’s also possible to apply a Spectrum Highlight on your planogram.
For example, if you need to analyse Days of Supply to identify the products that will run out of stock quickly, you can simply apply a Spectrum Highlight. The GIF below illustrates a Spectrum Highlight for Days Of Supply.
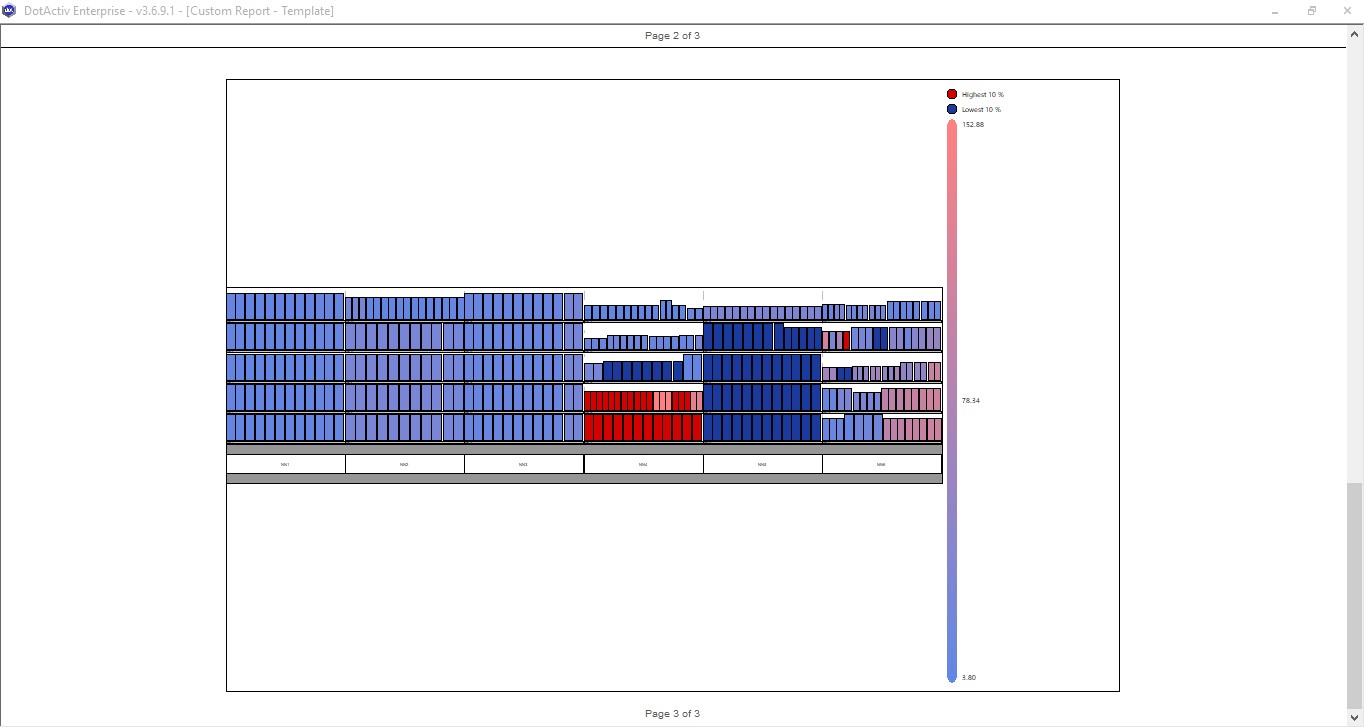
Again, looking at the image above, you can visually identify which products will run out of stock first. This information is processed much faster than if you were to view a large data list for all your SKUs.
These data visualisation tools can be created using DotActiv’s Professional or Enterprise license editions. As a starting point, it’s essential to set up a data cube for these visualisations to be accurate and provide value. You can read more about building data cubes in DotActiv here.
Conclusion
DotActiv Professional and Enterprise come standard with our Advanced Reporting Functions which can be used to create striking data visualisations. You can get a free 14-day trial of DotActiv Professional or Enterprise on our online store here.
