

Data cubes are used to easily interpret your data. Why? Because instead of analyzing large data sets, a data cube represents specific data fields within your database. The benefit of creating a data cube is that it facilitates the retrieval, analysis, and reporting of selected data points. In this way, creating one assists you in identifying trends, taking steps to improve your business, or deciphering possible variances.
To create a data cube, a reliable software tool is needed. It’s important to note that some tools may be better than others. This will largely depend on the flexibility of the tool. After all, you want to encourage your team to use the tool and avoid them needing to speak to your IT department each time they need to create a custom report.
Of course, the idea of creating a data cube can be daunting.
Fortunately, DotActiv’s all-in-one category management tool can help you create a data cube. All it takes is a few simple steps and access to DotActiv Academy.
If you’re looking to create a data cube in DotActiv, this article is a good starting point. That said, there is more to a data cube than simply setting it up. Considering the potential complexity of the topic, we have written this piece - to show you what a data cube looks like in action.

Using a data cube to identify specific consumer insights
There are many reasons to create a data cube.
Firstly, creating one helps you to identify consumer insights.
For example, let’s say you work in the sales and marketing department for a pharmacy retailer and your goal is to analyze the sales data of your different categories. This information will help you to identify which categories are the most popular amongst your consumers and which categories may need some attention.
Using this information, you can set about making better category management decisions for your business.
So how would you set up such a data cube?
The first step would be to select the data you are most interested in. For this example, instead of looking at all your market data, you would only need to consider a few key facts such as sales at sell, category, and sub-category.
Creating a data cube that only analyses this information ensures your team can easily identify noteworthy trends. When you draw up your custom report and use this data cube as your data source, you will be able to identify your top-performing categories and your team will be able to create marketing and sales tactics accordingly.
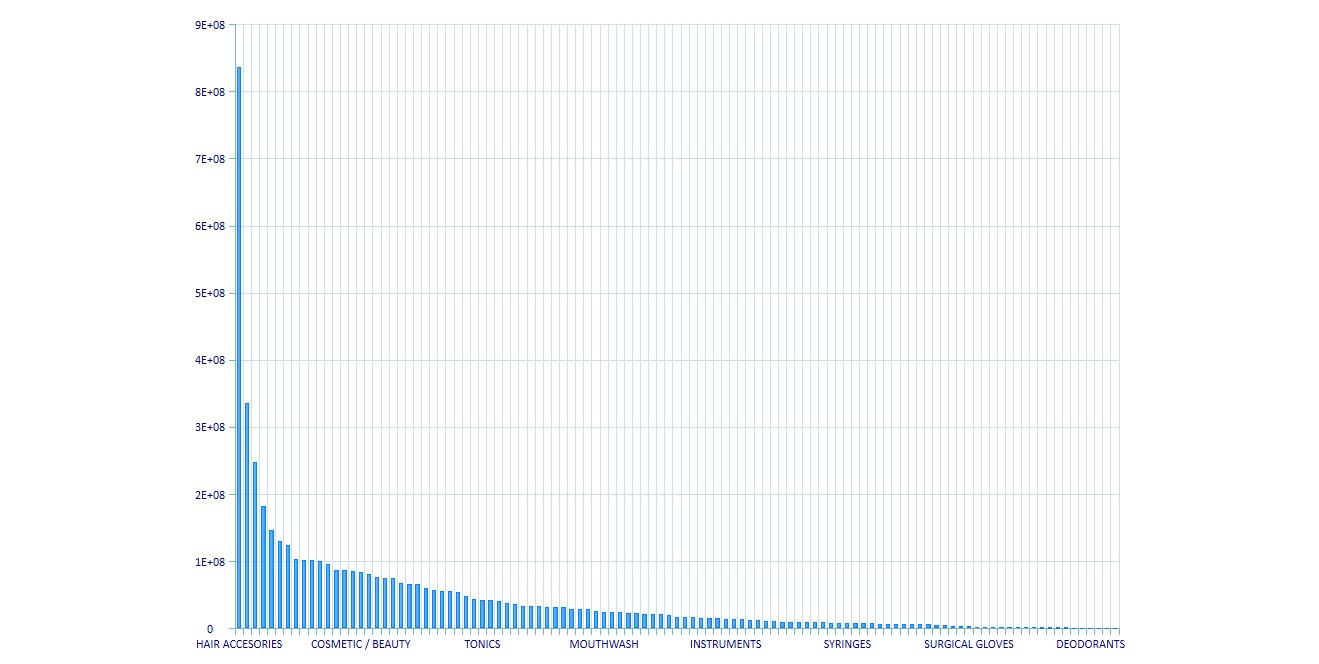
The image below illustrates the type of graph - 2D Clustered Column - that you can create using a data cube that includes sales at sell, category, and sub-category. Please note that it is not the only graph available to you to depict this information - you have multiple options from which to choose.
From the graph below, we can easily identify our top-performing category as the Hair Accessories category.

Using a data cube to measure performance
You can also use a data cube to report on your business performance.
For example, let’s say you work for a grocery retailer with five local stores. And, you need to identify which store contributes the most in terms of overall business profit.
The first step would be to select the data points of interest. In this case, you would only need to analyze profits and geographic regions. Once you have created your data cube, you can then begin creating your report.
The image below illustrates the type of report that you can create by focusing on this type of data.
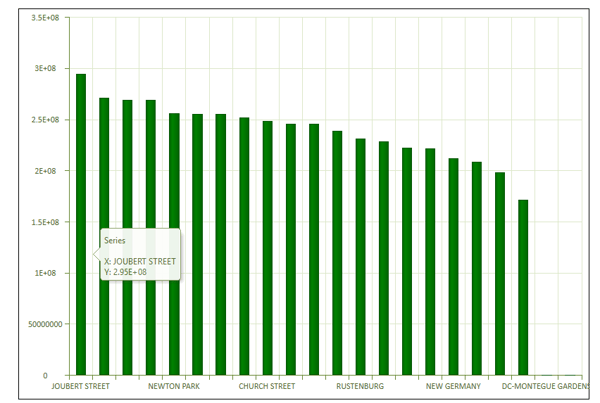
We can see in this image that Joubert Street is contributing the most in terms of overall business profit. Again, this is not the only visualization available to you. The report you choose is entirely dependent on your needs and what best represents your data and allows for easy interpretation.
Using a data cube to identify opportunities
You can use data cubes to identify opportunities. Once identified, you have a better understanding of where you need to improve.
Let’s say, for example; you work within the stationary category and would like to identify your top-performing brands. When setting up your data cube, you would only need to consider the brand and sales data of your products.
The GIF below illustrates how this type of data will be set up using DotActiv’s data cube function.
Using this data cube as a data source when creating your custom report will ensure you are focusing on analyzing your brands and identifying possible opportunities. As seen above, you have the flexibility to create your data cube using the specific data of interest as opposed to using all your data fields as a data source.
Using a data cube as a data source when building your custom report can help to create striking data visualizations. Why is it worth creating data visualizations? There are many benefits, two of which are it allows you to understand complex data and it empowers you and your team.
Conclusion
DotActiv Professional and Enterprise come standard with Advanced Reporting Functions. These Advanced Reporting Functions allow your teams to create Custom Reports with Data Cubes as a data source. DotActiv Professional and Enterprise are available on DotAcitv’s online store on a 14-day Free Trial. You can access our online store here.
