

As far as effective methods to segment your retail data go, hierarchical clustering is one worth considering. It’s simple and easy to use. It also provides an edge over the k-means algorithm as you do not need to specify the number of clusters to create clusters. That said, is this algorithm worth pursuing in your business? And how would you use it to generate meaningful, competitive insights?
What is hierarchical clustering?
Hierarchical clustering is an unsupervised clustering method that you can use to group your data. This algorithm is unsupervised because it uses a random, unlabelled dataset. The resulting clusters are displayed in a hierarchical tree called a dendrogram. This is helpful because the algorithm produces a clear graphical depiction of your clusters that you can understand and interpret easily. With this algorithm, you can create decision trees as well as category hierarchies for your business.
You are able to choose the number of clusters you would like to create where the distance between clusters and the input criteria is used to create the groupings. As the number of clusters increases, the accuracy of the hierarchical clustering algorithm improves.
Agglomerative and divisive clustering algorithms are two types of hierarchical clustering that you can use to cluster your data.
Agglomerative clustering uses a bottom-up approach that starts at the base of the dendrogram and begins with each observation. The algorithm groups observations that are close to each other until all the observations are joined at the top of the hierarchy.
Divisive clustering, on the other hand, is the exact opposite. It uses a top-down approach that starts at the top of the dendrogram and begins with all the observations grouped together. The algorithm further separates data points into smaller clusters until observation falls within a single cluster.
The advantage of hierarchical clustering is that it is easy to understand and implement. The dendrogram output of the algorithm can be used to understand the big picture as well as the groups in your data.
However, you may experience some challenges when you use this algorithm:
- It does not always provide the best solution: When you cluster multi-dimensional retail data that cannot always be visualised on a plot, poor solutions may be tricky to spot and resolve.
- The algorithm cannot run if there is missing data: You will need to remove these lines or estimate values to ensure the algorithm is able to run.
- The algorithm cannot run with different data types: When you use many different data types, it becomes difficult to compute a distance matrix. There is no simple formula that can work with both qualitative and numerical data at the same time.
- The dendrogram can be misinterpreted: The descriptors and composition of clusters may be difficult to interpret for all your business stakeholders involved with clustering.
How to use a hierarchical clustering algorithm
1. Clean and prepare your data
Before you can use any clustering algorithm, you will need to ensure that your data is in a clean and standardised format. Each row acts as an observation and each column acts as a clustering variable or parameter. You will need to remove any missing data or add in an estimated value. Clustering variables must be standardised so that they can be compared and used to create groupings in the data set. If you would like to use a language such as R, you must standardise the data so that you can compare variables.
2. Decide which variables to use
When you use a hierarchical clustering algorithm, you will need to choose one data type such as numerical or qualitative data. As noted above, you should standardise your variables.
For example, if you are working with two data types, the qualitative data could be given a numerical value so that the algorithm can produce accurate results. The input variables that you choose for the cluster analysis must be related to the business goal or challenge you are experiencing for this activity to be successful and meaningful to your business.
3. Stabilise the input variables to determine the similarity/distance between observations
You will need to specify the hierarchical clustering algorithm you would like to work with. This specifies the criteria to determine when clusters need to merge (the hierarchical clustering algorithm). Next, you will need to set parameters for the clustering algorithm that you choose:
- Maximum of complete linkage clustering: this method measures the dissimilarities between clusters and measures the maximum values of those dissimilarities as a linkage criterion. This method ensures that more compact clusters are produced;
- Minimum or single linkage clustering: this method measures the dissimilarities between clusters and measures the minimum of those dissimilarities as a linkage criterion. This method ensures that less compact clusters are produced;
- Mean or average linkage clustering: this method compares the dissimilarities between clusters and measures the average of the dissimilarities as the distance between two clusters;
- Centroid linkage clustering: this method measures the dissimilarities between the centroids of each cluster;
- Ward’s minimum variance method: this method aims to minimise the total within-cluster variance. This is achieved by merging clusters with the smallest between them.
4. Run the algorithm and retrieve the dendrogram
When you work with a dendrogram, you will see that each ‘leaf’ represents one observation. As you move up the hierarchical tree, the observations that are most similar to one another are combined into a branch which is further grouped together at the top of the tree.
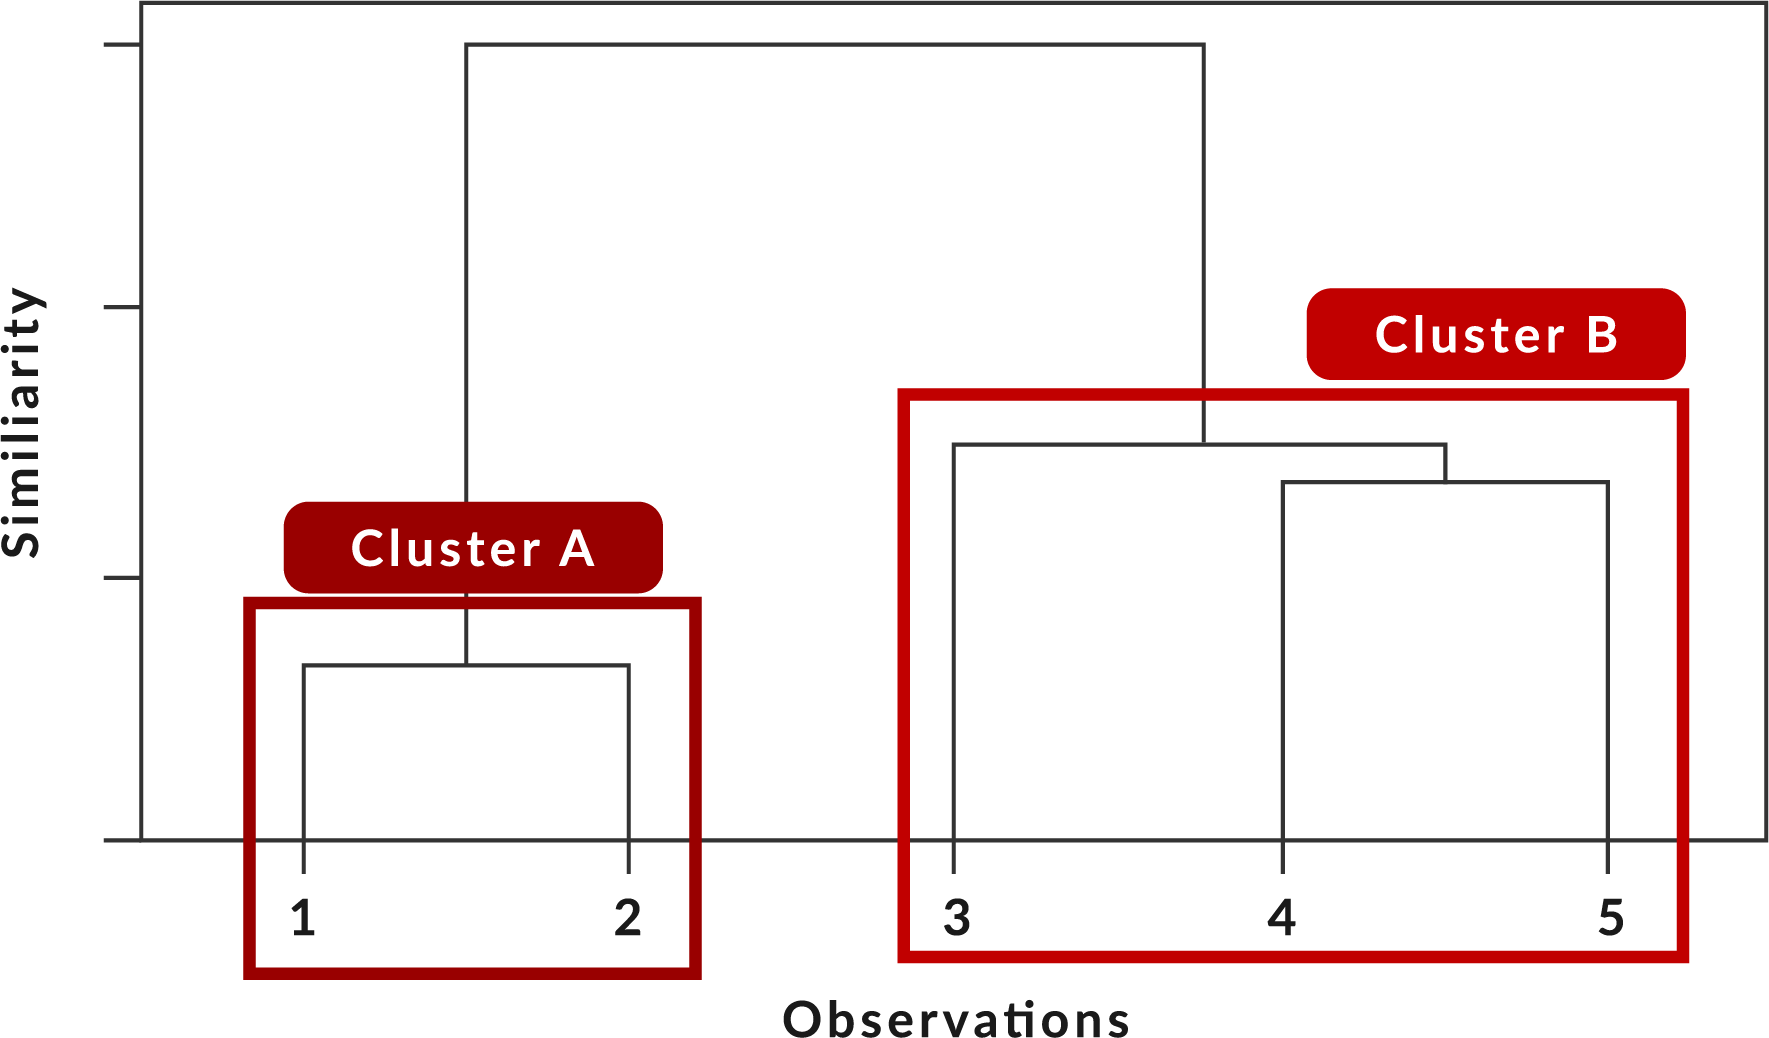
You can specify the height at which the branches fuse on the y-axis of the grid. This describes the difference between the two observations. The higher this height is, the less similar the observations are.
Interesting use cases for hierarchical clustering in business
Consumer segmentation/classification
You can group your customers based on low, medium and high levels of loyalty. A cluster analysis can be run based on variables such as basket composition, sales and purchase frequency. Once you have identified the segments using hierarchical clustering, your business can make better-informed decisions about marketing to these consumers to increase the level of loyalty to your brand or store.
This technique is also useful in the banking sector for profiling consumers based on their level of risk. Once clients are classified as either low, medium or high risk, a bank would use this information to choose which products to recommend to them, how much credit they should be granted and which interest rate they should receive based on the risk a business takes.
Behavioural segmentation
If you would like to segment your customer base using similar purchasing patterns, hierarchical clustering may come in handy. You can create clusters using demographic, psychographic and behavioural data as well as performance data to create complete and detailed customer segments.
Once created, you can customise product assortments, product displays, store flow and marketing messages for each cluster to improve customer satisfaction and your business turnover.
Product classification and hierarchy generation
You can use hierarchical clustering to classify your product-level data into a retailer hierarchy. This will produce a clear structure specified from the department, category, subcategory, segment, all the way down to a product level. This technique is helpful when creating product assortments, floor plans and shelf plans as well as understanding the consumer decision-making process through the production of a consumer decision tree.
Conclusion
Hierarchical clustering is a highly useful unsupervised clustering algorithm that you can utilise in your business. However, there are some challenges. You need to consider and determine the dissimilarity measure, type of linkage and cutoff point of the dendrogram when using this algorithm. Although there is no one right answer to these factors, each decision will reveal interesting aspects of the data that can be analysed and considered in your business.
Need assistance with clustering? Let DotActiv help. Find out more about our cluster optimization service or book a complimentary meeting with a DotActiv expert.
