

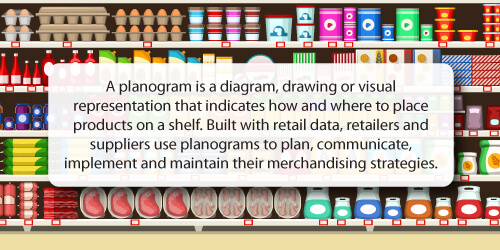
Do planograms make good business sense? It’s an age-old question that we never tire of hearing. Our answer is, of course, yes. Unequivocally. We’ve built our business on generating planograms and delivering planogram services. You might argue that that disqualifies us because we’re biased. However, that’s not true. Instead, it puts us in a prime position to explain why they are worth your time and effort.
In this article, you’ll find a handful of reasons - five in total - which we haven’t listed in order of importance. They are all valid reasons. What’s more, these are reasons that you’d find anyone in retail agreeing with - we're that confident. Why? Because they know, just as well as we do, that they revolve around and help you meet your two key objectives:
- Creating shopping experiences that meet the demands and expectations of shoppers; and
- Maximising the sales performance of your store.
1. They can help you deal with space elastic demand
The first key reason to use planograms is that they help with space elastic demand. That’s straightforward because it’s in the subheading. But what is space elastic demand?
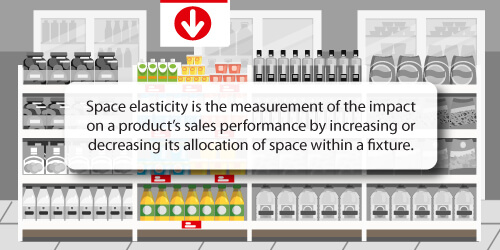
There are various factors that influence this elasticity, including the product, price, brand seasonality and more. In the context of planograms and retail, it’s about ensuring that your popular and profitable products always receive the correct amount of space on your shelf.
So how can planograms help you here?
If you’re using DotActiv software, you can use one or more of the various tool functions therein. That includes functions such as Sales, Weekly Movement, Days of Supply and Highlights, to name a few.
In the case of the Highlights function, you can identify the top and bottom percentages of products on your planogram. Once that happens, you can know which products contribute the most to sales and those that sell quickly. With that information, you can allocate the correct space for each product on your planogram and store shelf.
Let’s say, for example, you give too much space to a slow-moving product. One that hardly contributes to the category. You’d thus lose sales because no one is buying the item while it ages and becomes unsellable. Meanwhile, there is not enough shelf space to place your popular products that sell out quickly.
However, if you give it and the other products on the shelf the space they deserve, you’ll experience a higher stock turnover rate, which leads to increased sales.

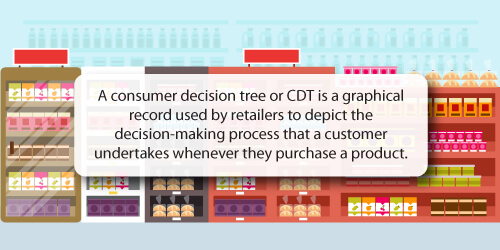
2. They can help you cater for consumer behaviour and demand
When guided by a well-designed consumer decision tree, you can build a planogram that creates a seamless and efficient shopping experience for your customers. More importantly, it allows you to cater to demand.
For context, it’s worth first explaining consumer decision trees.
A well-thought-out planogram merchandised according to how customers prefer to shop in a category makes their lives easier. If the opposite is true, and shoppers struggle to locate items, shopping becomes frustrating. No one wants that!
It’s also worth looking at the goal of planograms since it fits in well with this point.
You’d build planograms to increase your sales and profitability by ensuring that your shelf displays offer the right selection of products to reach your shoppers at the right place and time. That’s textbook supply meets demand. How else could you describe it other than to say you’re meeting demand and catering to the shopping behaviour of your customers head-on?
Let’s use the example of the Liquor category to illustrate this. Liquor is a massive category and if products are not categorised appropriately, your customers will struggle to locate what they want.

For wine, you might want to planogram the products from category to subcategory to segment and then subsegment. Of course, the products that fall under these titles depend on what type of wine your customer wants to buy.
For instance, when planogramming Box wine, it's the category. Then, the size of the box wine could be the subcategory, the brand of the box wine is the segment while the type of wine is the subsegment.
These decisions were all based on how a shopper usually shoppers for box wine. Therefore, if you were to visually merchandise according to the shopper's preferences, it's easier for them to locate what they want. That means no frustrated shoppers and more money in your back pocket.
3. They can help you to improve your stock control
Not having control of what comes in and goes out of your business - your stock - can result in multiple challenges for your business. That includes:
- Compromised business stability;
- Stunted business growth; and
- Loss of reputation.
Those are only a few consequences when you fail to keep proper stock control. Fortunately, planograms and space planning can help you improve it if you’re in such a position.
How?
It comes down to the days of supply (DOS) on your planogram.
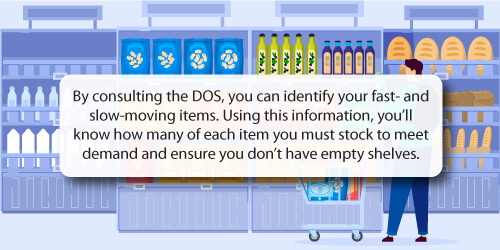
In DotActiv, the DOS indicator shows a numerical figure based on past data to indicate how long your products have remained on the shelf before selling. A high DOS means that the product, with its current number of facings, will stay on the shelf for longer.
If you’re looking to lower your DOS, you can reduce the facings you give that product. It's a good idea to do that in the case of a poor-performing product so that it doesn’t take up too much space on your shelf - see space elastic demand above. You can then provide more facings to another product that shows an uptick in sales. The result is better stock control as you’re able to bring in more products that are selling well while exiting those that are not.
Let’s go back to the Box Wine category example that we used above and say that Product A is the Known Value Item (KVI) within the category.
That means this product requires more space on the shelf. To give it the right space in-store, you can look at your DOS, which will indicate where you can free up shelf space by decreasing facings for poor-performing products in the Box Wine category.
In so doing, you’ve optimised your shelf space - making the shopping experience easier while maximising your sales. Everyone wins.

4. They help you to attract and retain customers
So you want to encourage customers to visit your store and please them while they shop. One way of doing that is to stock the right products at the right time and in the right quantity. We’ve mentioned that already in this article. The correct product assortment is critical to success.
However, that’s only part of the solution - you also need to present these products so that your customers can find them easily. That’s where planograms can play a role. More specifically, it’s the merchandising principles and techniques you use when building your planogram.
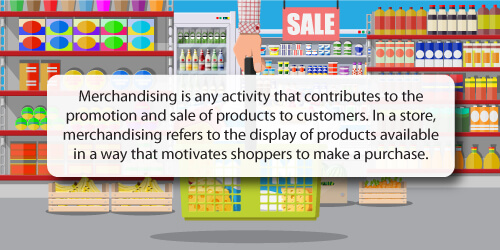
By using specific merchandising principles and tactics, you can attract customers.
For example, if you were to merchandise products according to the size of the products, the price or the colour, it makes it easier for your customers to locate what they want.
Also, by creating a pleasant shopping experience, you’re subconsciously telling shoppers that they can expect more of the same if they return. And so they do. Again and again.
Another way to attract shoppers is to think strategically about where you’re doing to place your KVI products. Your KVIs are the items that drive the price perception of your customers and are typically items that they purchase whenever they visit your store. If you place these items at the entrance of your store, you can grab their attention and entice them to walk in.
If you’re looking to improve the merchandising of your products in-store, here are a few principles to consider:
- Give your products a minimum of two facings, regardless of their performance or days of supply;
- Always keep your large products at the bottom of your drops where you can to make it easier for shoppers to take them off the shelf and place smaller products above them;
- Merchandise your high-performing products at eye level;
- Place your house brands at the start of your aisle and ideally beside a popular brand to create a perception of value.
There are many more merchandising principles available to you and especially if you want to encourage customers to return. While they’re shopping in your store, we’d also recommend you cross merchandise products where possible to take the shopping experience to the next level.

5. They help you to maximise your sales per square metre
In this article, we’re written primarily about how planograms can help you to please your customers. All of the above points focus on that.
But what about you? How can planograms help your bottom line? Well, let’s read between the lines - by pleasing your customers, you’re making sales, which means you’re on your way to both key objectives.
It’s worth reiterating though that planograms can help you not only make sales but also maximise your sales per square metre.
When placing products on a planogram, you can increase the amount of stock and facings of a given line in a section based on its sales and units performance. Meanwhile, you can also decrease the amount of stock of your poor-performing lines.
That leads to a better return on investment per square metre because you’re giving your stock the exposure it needs in line with its performance. You might notice that that ties in with a lot of what we’re already written. That’s because everything is connected.
What gives you the edge - and especially when building planograms in DotActiv software - is you can use sales data to simulate the performance of your products while making merchandising decisions.
The sales and unit data drive the decision for the range you use in your category.
Let’s use the Perle wine category as an example.
You might give it one or two drops within your liquor department based on a previous decision and data. So how can you maximise the space given to it?
The goal might not be to have a wide range due to lack of space, but you can rather have a narrow range that performs well. In planogramming this category, you could remove those products that have low sales and sell few units, thereby creating space for your profit-generating and traffic-building products.
By eliminating the low-performing products, you’re maximising your space, and by association, opening the door to increased sales. You just happen to please your customers at the same time.
Conclusion
At the beginning of this article, we mentioned that we believe data-driven planograms are worth the time and effort. But now, we shouldn’t be the only ones in agreement - they are undeniably a tool that you can use to improve your retail business.
- They help you deal with space elastic demand
- They help you cater for consumer behaviour and demand
- They help you improve your stock control
- They help you attract and retain customers
- They help you maximise your sales per square metre
What else could you want?
It’s specialist software like DotActiv that can help you build them - you can check out our different editions and compare the features of each. But let’s say you don’t have the time or resources necessary to build planograms. There’s nothing wrong with that.
In that case, we’d encourage you to speak to us. You can book an exploratory consultation with a DotActiv expert here and we can walk you through how we deliver performance-enhancing planograms.
About the contributors
Caylin Fortuin joined DotActiv in 2021 as a category planner, working on the Dis-Chem account to provide our end-to-end category management services. She has since rotated to our UPD account, where she delivers data-driven planograms and provides expert category management advice. She has a Bachelor of Commerce (Honours) in Marketing Management from the University of Pretoria.
Dylan Colbet joined DotActiv in 2021 as a category planner. In his time at DotActiv, he’s worked on various accounts across various industries. Today, he works on the Makro Liquor account. He has a Bachelor of Arts (Honours) in Strategic Brand Communications from Vega School.
Kelly Cordeiro joined DotActiv in 2017. Since joining, she has had experience running many accounts, including ACDC, Ultra Liquors, Diageo, JDE Coffee, GSK, Shield, Permoseal and Pick n Pay.
Michael Puckering joined DotActiv in 2017 as a space planner. Since then, he has worked on various accounts, gaining extensive experience across different retail environments. Currently, he runs our ACDC account.
Portia Pretorius joined DotActiv in early 2020 as a space planner where she worked on Indigo Brands in Cape Town. Since then she moved to Johannesburg to join the Makro General Merchandise account. She has a Bachelor of Consumer Science (Honours) with Business Management from the North-West University.
