K-means clustering is an unsupervised algorithm which you can use to organise large amounts of retail data to generate competitive insights about your business. There are many use cases which can help you implement this practice in your business and compete strategically in the retail market. But how can you use a k-means clustering algorithm effectively to understand your customers and cluster your stores?![]()
What is k-means clustering?
You can use cluster analysis to group data points according to the similarities between them. This practice has a widespread application in business analytics and can help you to achieve your business goals. You can use the k-means algorithm to maximise the similarity of data points within clusters and minimise the similarity of points in different clusters.
As noted above, it is an unsupervised algorithm that does not make use of labelled data or a training dataset. This type of algorithm is suitable for use when you have categorical data (e.g. grouping based on category, subcategory and brand). For example, you could use this information to group products by sales to assist your buyers with the assortment planning process.
As far as clustering algorithms go, it is simple and flexible to use in your retail business. With it you are also able to cluster large data sets in a short amount of time which is necessary when you work with retail data.
However, this algorithm also has some disadvantages. You would need to specify the number of clusters, which can be time-consuming or detrimental to your business if you don’t follow a statistical or knowledge-backed method. The k-means algorithm is also sensitive to outliers which can change the grouping of your data.
How to use a k-means clustering algorithm
1. Collect and clean your data
For a clustering algorithm to be used, you will need to ensure that your data is in a standardised format. Each row acts as an observation and each column acts as a clustering variable or parameter. You will need to remove any missing data or add in an estimated value.
Product cloning in DotActiv comes in handy at this point if you are clustering a product category. Clustering variables must be standardised so that they can be compared and used to create groupings in the data set.
2. Select the number of clusters you would like to use
When you use a k-means clustering algorithm, you will need to select the number of clusters you would like to work with. Selecting the optimal number of clusters is important because this will fall somewhere between full localisation or standardisation (i.e. a store-specific or mass-market approach).
Working with the optimal number of clusters for your retail data and market environment will facilitate the use of resources in a more efficient and effective manner. You can select the number of clusters using industry-related knowledge or three different statistical methods when you use the k-means algorithm.
- The Elbow method: To determine the optimal number of clusters, you will need to run the k-means algorithm for different values of k (number of clusters). For each value of k, you will then need to calculate the total within-cluster sum of squares (wss). You can then plot the values of wss on the y-axis and the number of clusters (k) on the x-axis. The optimal number of clusters can be read off the graph at the x-axis.
- The Silhouette coefficient: To determine the optimal number of clusters, you will need to measure the quality of the clusters that were created. This value determines how closely each data point is to the centroid of its cluster. A high average silhouette coefficient indicates successful clusters. This method checks the silhouette coefficient for different values of k. The optimal number of clusters is, therefore, the maximised silhouette value for the data set.
- The Gap Statistic: To determine the optimal number of clusters, you will need to know the variation between clusters for different values of k with their expected values of distribution with no clusters.
3. Run the clustering algorithm
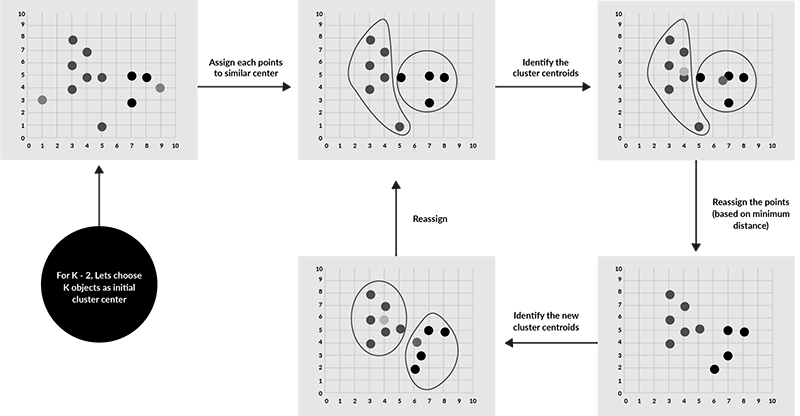
The k-means algorithm identifies mean points called centroids in the data. It then assigns each data point to a centroid to form the initial clusters. The algorithm will measure the distances between each point and the centroids and assign each point where this distance is minimised.
The algorithm then re-iterates to reallocate the points to a new centroid where data points in each cluster are homogeneous and heterogeneous from data points in different clusters. You can see this process in the image below.

You can retrieve the following information from a cluster analysis which can be used to profile, analyse and target each cluster effectively:
- The vector of integers (this identifies which cluster each point is allocated to);
- A matrix of cluster centres (the clusters can also be represented on an axis);
- The total sum of squares within each cluster;
- The inter-cluster sum of squares; and
- The number of data points within each cluster.
4. Evaluate your k-means clusters
Once you have clustered your data, it is important to evaluate the clusters.
Your goal shouldn’t be to just create clusters from your data. It should be to create meaningful, accurate clusters that you can use to generate insights about your business.
Good clusters are those where the data points in each cluster are close to the centroid and close to each other.
You can evaluate your clusters using inertia or the silhouette coefficient. Inertia measures how far apart the data points in a cluster are from each other. Inertia is measured from 0 upwards and a small inertia value indicates successful clustering.
Although you can use the silhouette coefficient to determine the optimal number of clusters, you can also use it to evaluate your clusters. This value measures how far away the data points in one cluster are from the data points in another cluster. This value is measured from -1 to 1 where an optimal score would be closer to 1.
Interesting use cases for k-means clustering in business
Consumer segmentation
Once you have completed cluster analysis, you can identify consumer segments. To do this, you can use demographic, psychographic and behavioural data as well as performance data to cluster your consumers for a particular product category.
Next, you can profile your clusters to understand your consumers better and describe them according to the variables used for cluster analysis. You can leverage this information to tailor your marketing messages, product assortments and the overall shopping experience to meet your customer’s needs and increase your ROI.
Delivery optimisation
Retailers and suppliers have looked to optimise their delivery process using k-means clustering. The delivery routes and patterns of trucks and drones have been monitored to find the optimal launch locations, routes and destinations for the company.
Document sorting and grouping
You can group electronic files according to category, tags, content or frequency of use using k-means clustering. The algorithm views each document as a vector and the frequency of certain terms to classify and group the documents.
Customer retention
You can use k-means clustering to analyse and group customer churn to identify and profile your consumers based on retention. You can use variables such as frequency of purchases, how recently the consumer visited the store, average spend per trip and basket composition to analyse and predict retention rates of particular customer segments.
Discount analysis
You can use k-means clustering to analyse different groups of shoppers according to their discount purchase behaviours. Customers may be more likely to purchase bundled products, products with an everyday-low-price strategy, or products on sale before expiry. You can use the algorithm to identify purchasing patterns among your shoppers and use this information to make decisions regarding pricing and promotional strategies.
Conclusion
Before you decide to use the k-means clustering algorithm, you need to review which algorithm is right for your business. Your goals, objectives and available resources must be evaluated when making this decision. K-means is a simple and flexible algorithm to trial when you are getting started with clustering but has some challenges that you should be aware of.
Looking for assistance to profile and understand your clusters? Let DotActiv help. Find out more about our cluster optimization services or book a complimentary meeting with a DotActiv expert.


