
Bread isn't fancy food. It's a staple, and has been throughout history. But it's also an integral part of many cultural diets. And you also make it with humble ingredients. However, place it in the right hands, and it goes a long way, providing sustenance to countless people. Where are we going with this, you may ask? Well, you can say the same thing about sales data as you can about bread.
You could view it as the most basic dataset. That’s not a slight though. Look closer, and you'll understand that it's a vital component and, in the right hands, can provide invaluable insights which can drive your retail business to the next level.
Let’s consider a survey conducted in 2019 by RetailWire and data science firm, Alteryk. The survey, which polled some 350 brand manufacturers and retailers, found:
81% of respondents use data analytics - sales data included - to gather shopper insights. 76% said these insights were critical to the performance of their organisation.
That’s only one survey - there are many others conducted each year that produce similar results. All point to the same conclusion - sales data is your bread and butter.
But what does sales data include? And what are its many different types? That’s what we plan on uncovering in this article.

Sales data defined
Before we can unpack the different types of sales data that are worth analysing, it's critical to understand sales data and what it entails. If you'd rather read about the different types, you can navigate to the next section.
So what is sales data?
Sales data form the information that represents any sales transaction related to a card sale, refund, credit or cash payment of goods. It includes any amounts or figures that indicate the sales or units sold for products or services daily, weekly, monthly or yearly.
It is also data that usually includes a barcode and, usually, a product description. As for where you can collect it, you may find it:
- At the Point of Sale;
- From Loyalty cards
- Within Market data.
Of course, we can’t discuss sales data without looking at units data. Why? Because sales and units data are linked.
If sales refer to the currency value of a product, units refer to the number of those products sold.
Thus comparing the number of units sold to the number of sales gives you an indication of the average retail selling price of a product.
This, in turn, indicates whether the sales of a product are high due to a high volume of sales or due to the retail selling price. A high volume of sales shows a good amount of demand for the product.
What’s more, by comparing your sales and units data, you can identify and implement category roles and strategies in your store. That's not the only reason why it's critical to understand both.
You can also expect the use sales data to do the following:
- Calculate your Average Contribution
You can determine your average contribution on a category, subcategory, segment, sub-segment and even SKU level. You can also use your average contribution to understand and justify product flows and space allocations on shelves.
- Identify Customer Trends
The location of your stores and customers' needs in the surrounding areas influence consumer trends. It is thus critical to identify these trends to cater to them, which can lead to upticks in future loyalty.
- Identify Opportunity Gaps
By identifying opportunity gaps, you can create scope for customer satisfaction. On top of that is the opportunity to maximise the selling potential of your retail space.
By determining your days of supply (DOS), you’re in a better position to identify when to restock your shelves or order more products. With improved stock replenishment, you can ensure that you always have the correct amount of stock on hand.

Sales data types
Data is not a one-size-fits-all type of thing. Just like different types of grain are needed for different types of bread, each client is unique, and their goals require different data types.
There are many types of sales data. When it comes to retail, there are a few forms of data that critical to know and understand. Below are a select few.
1. Average Sales Revenue
The first dataset is average sales revenue.
Here's the formula:
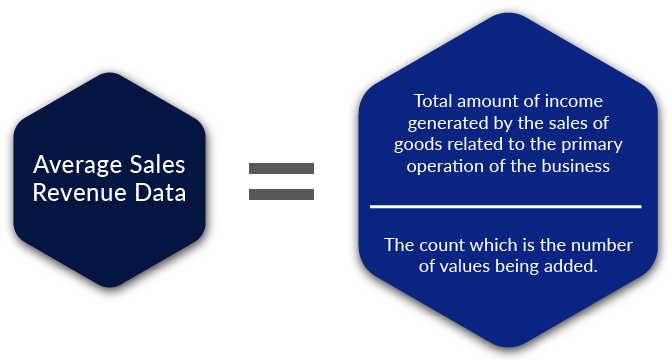
Average sales revenue data can be chosen for different periods. That includes weekly, monthly, quarterly or annually. Again, it depends on what you want to measure.
For example, if the monthly average is needed, the total sales revenue will be divided by 12 months (annually).
You can use your average sales revenue to:
- Identify consumer trends;
- Determine forward share; and
- Determine stock replenishment.
2. Average Customer Lifetime Value (LTV)
The second dataset we look at is the average customer lifetime value or LTV.
Average customer lifetime value is the total amount of money that a customer will spend from acquisition through the end of the relationship with a business.
In other words, as pointed out by relationship marketing software firm, Optimove, it is the “average order total multiplied by the average number of purchases in a year multiplied by average retention time in years. This provides the average lifetime value of a customer based on existing data”.
It consists of the representative loyalty of a client, the relationship between client and service provider, the services the service provider is providing and how they can grow and add value to the account.
You can use LTV to estimate and forecast the following:
- The profitability of a customer or customer group; and
- The potential for your business's long-term growth.
3. Average Profit Margin
The third dataset we want to touch on is average profit margin.
You can use average profit margin to determine whether or not your business is making money as it measures your business’s profitability.
It can also determine which percentage of your business's sales is turning into profit.
Profit margin gives you an insight into your business’s financial health, your management skill as well as the potential for growth.
Are you looking to calculate your average profit margin? The formula is as follows:
Divide your net business income by your revenue or sales and multiply the answer by 100.
If you’re looking to determine your profit margin, Mike Kappel, a serial entrepreneur and CEO of Patriot Software provides a good breakdown. That includes looking at your net profit margin, gross profit margin and operating profit margin.
4. Average Revenue Per Unit/Product
The last data set - but certainly not the least - that we want to cover is average revenue per unit or product.
Average revenue per unit shows you the amount of money your retail business can anticipate to obtain from selling one unit of product. You can calculate it by dividing the total revenue by the number of units sold.
As for what you can achieve with this dataset, that’s simple.
For one, you can identify opportunities to grow your business revenue. Want to know what you need to stock and how much to turn a profit? Then you can look at this metric.
It can help you better understand which products generate the most revenue and which products are not. In turn, you can then decide which products to keep in your range and which products to remove.
You can then use this information to:
- Develop and enhance your product offerings;
- Boost the revenue of your business;
- Plan your procurement and stock replenishment activities; and
- Establish future projections, strategise and plan accordingly.
Conclusion
In the bread-making process, the preparation of the dough is the most integral part of the entire process. If the dough isn’t properly kneaded and worked, the bread won’t rise. The same can be said about your sales data. If the data isn’t properly interpreted and analysed, your business won’t be able to work with it.
It is critical to determine your needs and what you want to achieve before choosing the correct data type to help you achieve your objectives.
Sales and units data can help you identify opportunities, determine flows, help with procurement, define forward share, assign category roles and strategies - the list goes on.
About the contributors
Carlie Smith joined DotActiv in 2021 as a space planner, working on various ad-hoc accounts, including Diageo, JDE Coffee and more where she delivers data-driven planograms and expert category management advice. She has a Bachelor of Consumer Science with Business Management from North-West University.
Marizelle Van Eeden joined DotActiv in 2018, where she worked on the Food Lover's Market account as a space planner. She has since moved on to work on a few of our supplier accounts before her promotion to account manager. Today, she oversees various ad-hoc accounts. She has a BConsumer Science in Retail Management from the University of Pretoria.
Runet Kritzinger has been with DotActiv since 2015, primarily managing the Makro Food and Liquor account. Today, she works on and oversees one of our first major overseas services accounts. She has a Bachelor of Consumer Science with a Business Management degree from North-West University.