

We’ve written about the importance of live feedback when building planograms for any category. We stand by that. However, it shouldn’t stop there. Your success relies on real-time feedback when building planograms, creating clusters, or planning your assortment. It’s the same when developing floor plans for your store. Without continuous feedback, you are everything but efficient.
That's an issue and especially if you plan on making an impact as a retailer. Fortunately, there is a viable solution - DotActiv's floor planning software, which has various features built specifically to help you improve your efficiency.

What are DotActiv's Floor Plan Live Graphs?
As with the Live Graph function built for planograms, DotActiv’s floor plan live graphs allow you to understand what’s going on on your floor plan as you construct it. That's through a list of highly customizable graphs, which we'll unpack further in this article.
Suffice it to say; you can evaluate and analyze the intricate details of your floor plan.
That speaks to the benefits of using this function. For one, you can understand where your best products are on your floor plan.
That means you can identify hot (and cold) spots and make the necessary adjustments. If there are too many hot spots in one area of your store, you can spread them out. That can help ease floor congestion and increase customer spending as you expose them to more of your merchandise.
If there are cold spots, you can move a top-performing product closer to them so shoppers walk past these products when they shop. Of course, you can’t do this in a way that frustrates your customers. Instead, it’s a subtle but purposeful tactic. You can send them down a path but provide them with what they need as they walk it.
DotActiv’s floor planning function, which includes reporting, highlights, heatmapping, and optimizer features, is available to clients purchasing our Enterprise edition.
When we deliver our Floor Space Optimization service, our category management experts also use DotActiv Enterprise.

How do you set up DotActiv's Floor Plan Live Graphs?
After opening the DotActiv software, ensure you have a floor plan open. It can be new or one that you have worked on previously. To open a floor plan or create a new one, navigate to the Space Planning tab and select the appropriate option from the Floor Planning section.
With an open floor plan, the DotActiv software automatically directs you to the Tools bar. Once there, you must scroll to the right to find the Live Graphs icon, as shown below.
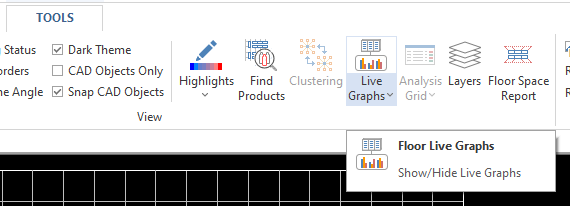 Finding the Live Graph function for floor planning
If you have never worked with Live Graphs before, you must set it up. Clicking on the top half of the Live Graphs icon or the bottom half will bring up the Setup window.
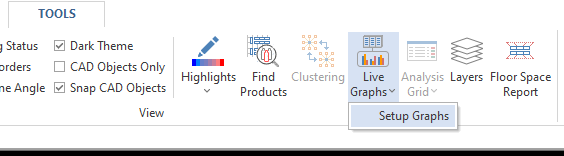 Clicking on the Live Graphs icon brings up the 'Setup Graphs' option
As you can see below, you must add all the necessary information you’d want to include. Click on New to begin.
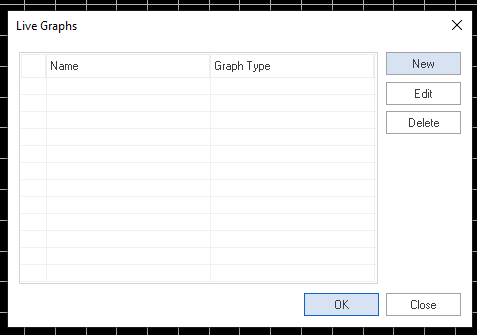 Live Graphs setup window for floor planning in the DotActiv software
If you have worked with the Live Graphs function when building planograms, you note that you follow the same process. Clicking on New takes you to the Graphs Properties and Preview window.
If you have set up this function before but want to make changes, you can select the graph in the Name column and click on Edit. It will take you to the Graphs Properties and Preview window, as seen below.
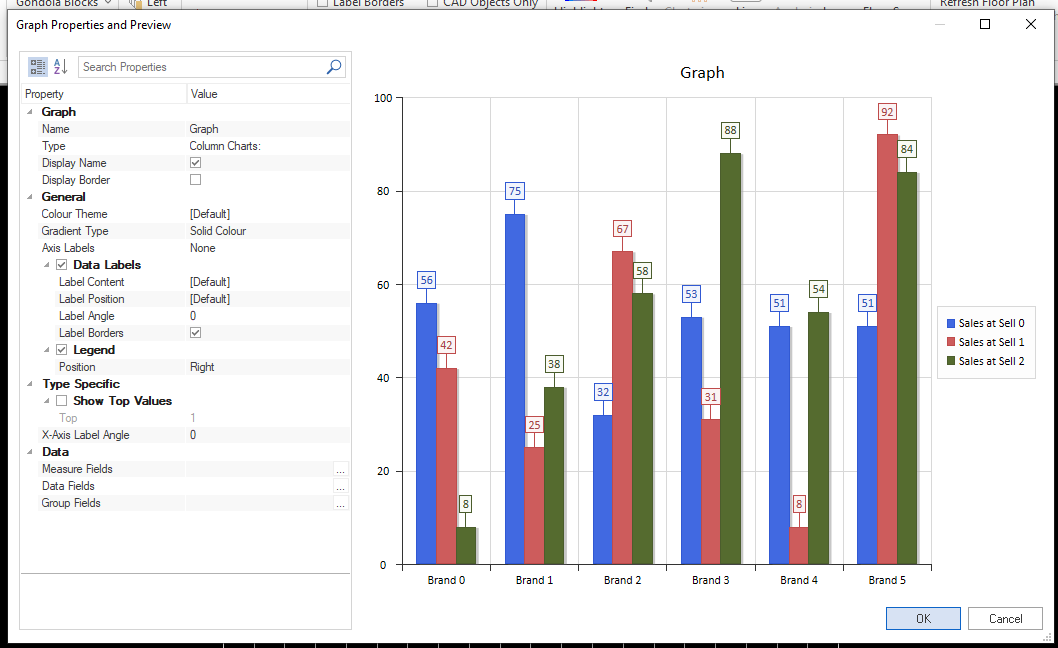 Graph Properties and Preview window in DotActiv software
At this stage, you can add all the information to the graph you want to see alongside your floor plan. The various sections are:
- Graph;
- General;
- Type Specific; and
- Data.
First, you must name the graph that you’ll be working with. You can do that by clicking on Graph in the Value column next to Name. Next, select the graph that you would like to use.
The DotActiv software has over 40 different graphs across eight options. These include Column, Pie, Bar, Funnel, Pyramid, Line, Area, and X Y (Scatter) charts. Once selected, you can display either the name and the border or neither.
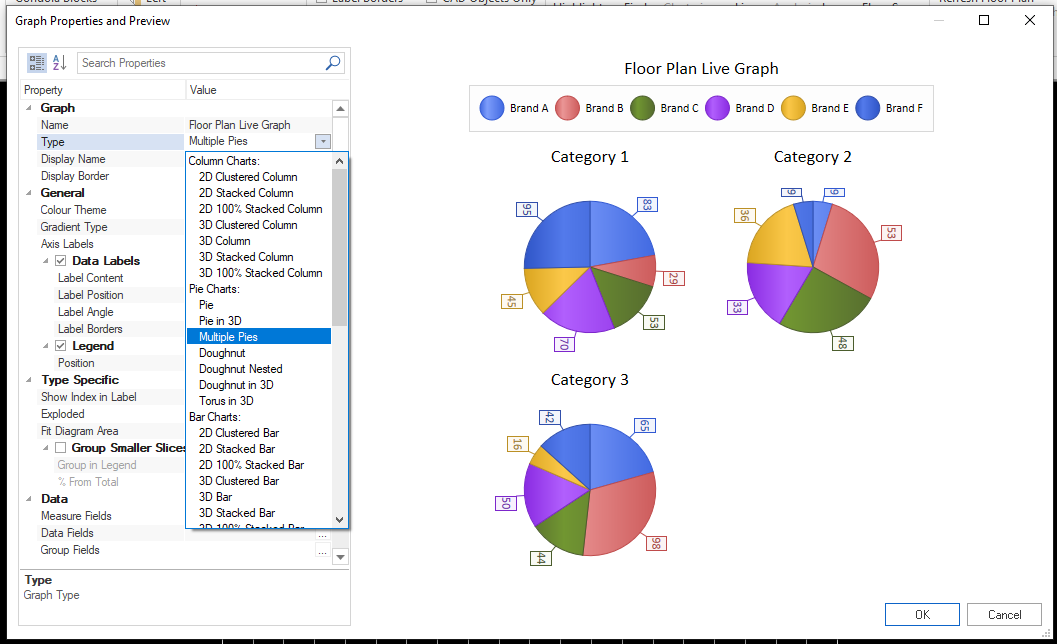 Example of the Multiple Pies graph in the DotActiv software
Under General, you can choose your color theme, gradient type, and axis labels. If you want to use axis labels, there is further information that you can input under the Data Labels and Legend subsections.
For the first, you can choose your Label Content - Value, Percent, Value & Percent, Series & Values or leave it as default.
You can also choose your label position - Centre, Inside End, Inside Base, Outside End of leave as default. The label angle is self-explanatory. Your options here range between -90 and 90 degrees.
For the Legend subsection, you can position it to the top, bottom, left, right, or top right of your graph. By default, your legend, if toggled on, is to the right of your graph.
Next is the Type Specific section. Here, you have the option to choose to show your top values. It’s worth noting that choosing a specific graph type will change your options in this section.
For example, if you choose from the Column or Bar chart options, you can choose to show your top values or not. Meanwhile, if you selected any of the Pie chart options, you’d need to decide on choosing to Group Smaller Slices and a % from Total.
Finally, you need to choose your data. As with the Planogram Live Graphs options, the DotActiv software breaks this section into three. There are your Measure Fields, Data Fields, and Group Fields.
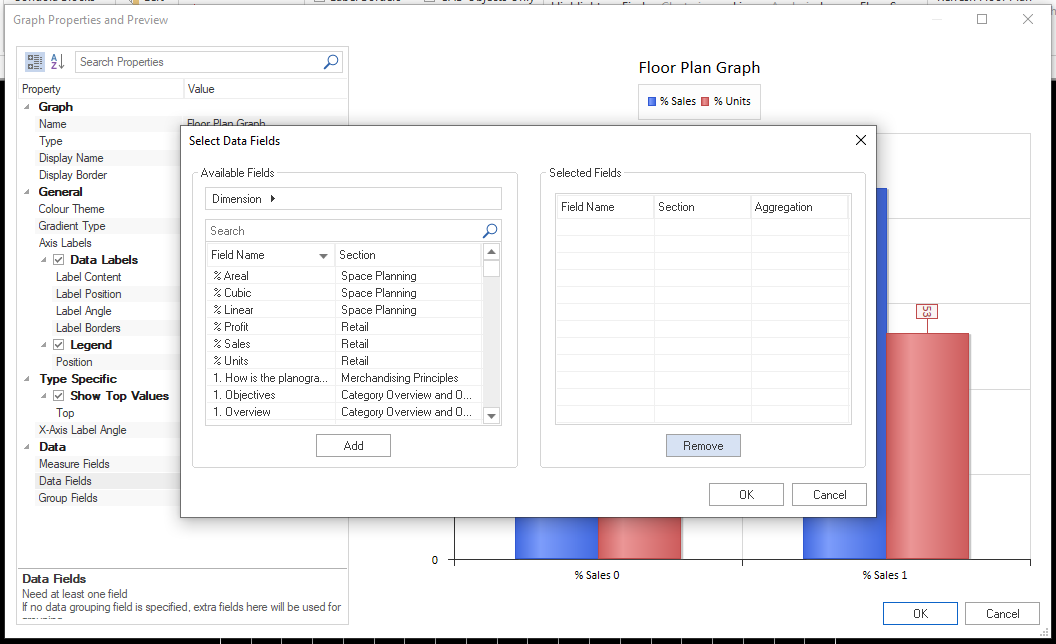 Select Data Fields window in the DotActiv software
Again, we recommend you select options for at least your Measure and Data fields. Doing so allows you to dig into what is happening on your floor plan, providing more information to make better decisions. Your Group fields are optional.
It’s worth noting that if you choose not to select a Measure or Data field, a window will pop up informing you to select at least one field before you can go further.
 Example of setting up a Live Graph in the DotActiv software
Once satisfied that you’ve added all the necessary information to your graph, click on OK. Doing so redirects you to the Live Graphs window.
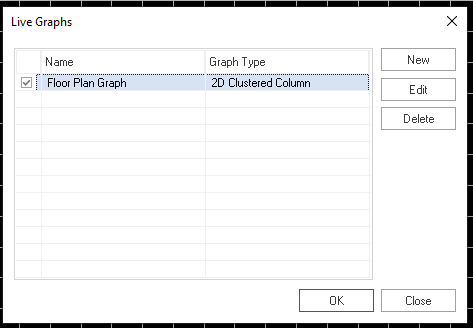 Choosing the Floor Plan Graph in the DotActiv software
Here, you can select the graph you set up and click OK to begin using it. If you’d like to make edits, click on Edit. You’re now ready to work with the Floor Plan Live Graphs function.
Your chosen graph will appear in a dockable window to the right of your floor plan, as seen below. Because this is a live graph, it updates in real time as you make changes to your floor plan.
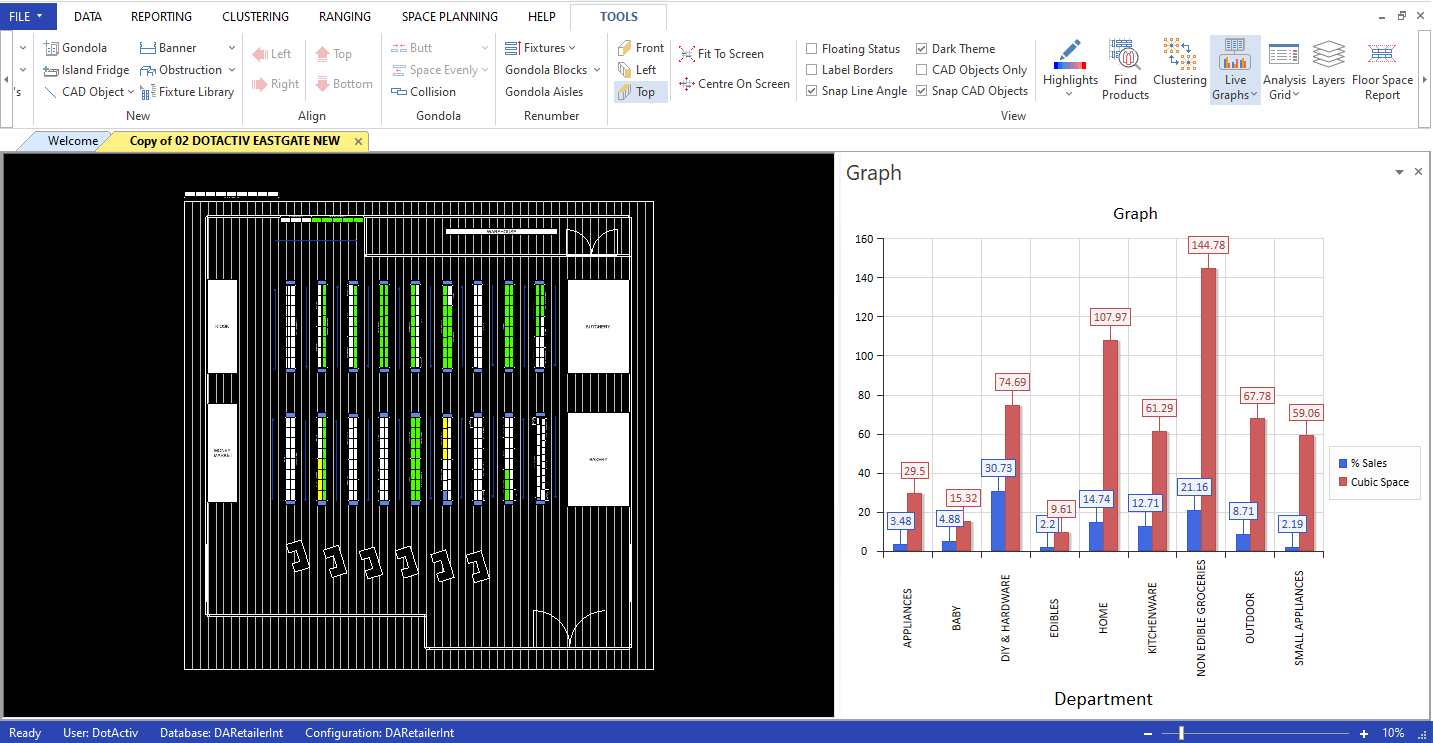 Working with the Floor Plan Live Graphs function. in the DotActiv software
That allows you to make better decisions when setting up your floor plan. It also goes back to the various benefits mentioned earlier in this article. By using the Live Graphs function when building your floor plan, you can ensure you create a space that is easier to shop.
 Example of clicking through your floor plan with an updated Live Graph in the DotActiv software
It’s also worth noting that you can have multiple graphs open simultaneously.
To do that, in the Live Graphs window, you can mark the checkbox next to those graphs you want to view (and work with) while developing your floor plan.
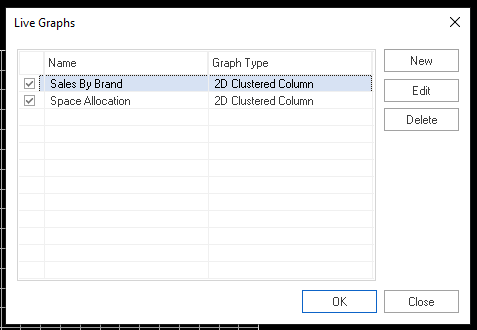 You can select to have two or more graphs open at the same time
You will see two tabs at the bottom of the dockable window when including two graphs. You can switch between the two to understand what's happening on your floor plan.
Conclusion
DotActiv’s Floor Plan Live Graphs is a feature that we’ve added to the software with the goal of helping you to build floor plans that can help you create better shopping experiences for your customers and maximise your sales.
Do you need assistance with a floor planning software solution or require services? Visit our online store here for more information or book a custom exploratory consultation here.
