

When building planograms for any category, it's critical to receive real-time feedback. Why? Simple - imagine completing an intricate, data-driven planogram only to find out once done that you need to make wholesale changes or start from scratch. I wouldn't blame you if you were angry or frustrated. Inefficiency is not welcome in the retail industry, and for a good reason.
Fortunately, specialised category management software like DotActiv has several features to help you avoid these situations. You can access these and others if you are a software client or use our Planogram Development services.
The first feature is our Live Graphs, while the second is our Analysis Grid (shown as ‘Grid’ in the software), both of which we unpack in greater detail below.

What are DotActiv's Live Graphs?
When building or tweaking any planogram in DotActiv software, we have the Planogram Analyzer feature, which allows you to evaluate the quality of your completed planogram according to criteria.
As with the Planogram Analyzer, DotActiv’s Live Graphs function enables you to choose from a customisable list of graphs, which you can view alongside your planogram as you work on it.
How do you set up and use DotActiv's Live Graphs
After opening up DotActiv software and choosing the planogram you want to work on, you can find the Live Graphs function in the ‘Tools’ tab in the ‘Planogram Analysis’ section. You might need to scroll right on the Toolbar to locate it.
It is worth noting that if you have never used this function before, you will need to set it up.
After right-clicking on the 'Live Graphs' icon, you can select ‘Setup Graphs’ from the dropdown menu. Doing so opens the ‘Planogram Live Graphs’ window. Select ‘New’ to open the ‘Graphs Properties And Preview’ window.
 Graph Properties and Preview in DotActiv
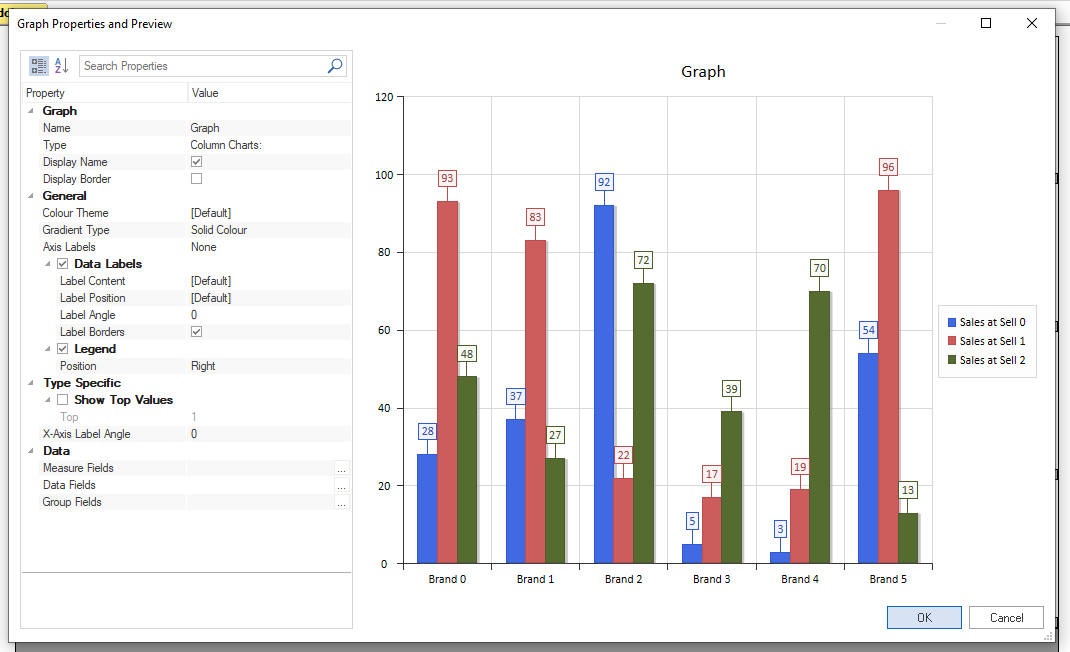
In this window (seen above), you can create and customise the different graphs you would like to have alongside your planogram. That includes Graph, General, Type Specific and Data sections that you must infill.
Let’s say, for example, you want to include a 2D Clustered Column alongside your planogram. You can select that by navigating to ‘Type’ under ‘Property’. Next to it, in the ‘Value’ column, you can find the graph under the appropriate section. You can choose between Column, Pie, Bar, Funnel, Pyramid, Line, Area and X Y Charts.
 Setting up a Live Graph in DotActiv
Under General, you can select the colour theme and gradient type for your graph. Do you also want to include axis labels?
If yes, you can toggle on ‘Data Labels’, which includes Label Content (by Value, Percent, Value and Percent or Series and Value), Label Position (Centre, Inside End, Inside Base or Outside End), Label Angle (0 to 90 degrees), and Label Borders (Yes or No).
If you want a Legend, you can toggle it on and decide where to position it on your graph.
Under ‘Type Specific’, you can show your top values and choose how many. For example, if you want to view your top 5 brands, you can input ‘5’.
Don't have the available resources to build planograms? Let DotActiv help you
Last but not least, you can choose your data. DotActiv software breaks this up into Measure Field, Data Field and Group Field. For the first two, you must select at least one. We advise you to choose more than one so that you can drill into your data. Group fields are optional in which you can create multiple series.
Once happy with your graph, click ‘OK’ to go navigate back to the ‘Planogram Lives Graph’ window. Here, you can select your newly created graph and open it up next to your planogram. It’s worth noting that you can have more than one graph open at a time next to your planogram.
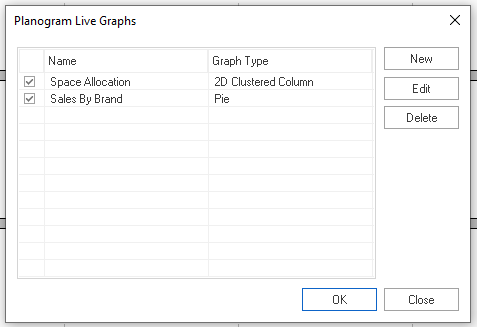 Planogram Live Graphs window in DotActiv
As seen below, once you've selected your two graphs, they’ll appear on the right of your screen in a dockable window. As you work on your planogram, the figures will update in real-time. For example, if you were to increase the facings of a product or remove a product from the shelf, you will see your graphs change.

Space Allocation and Sales By Brand graphs in DotActiv
Knowing this, it’s clear to understand why it's worth using this function. As you work with your products, the graph will update to reflect the data for your selected products to help you make better space planning decisions.
Do you want to maximise your shelf space? Do you want to improve your category profitability? Do you want to ensure product layout consistency? You can achieve all this when using this function.
This feature is available to all DotActiv Pro and DotActiv Enterprise customers.

What is DotActiv's Analysis Grid?
As with any of the other features that help you to build better, more efficient planograms, DotActiv's Analysis Grid is also one to consider.
In short, you can get an overview of your products, understanding the contribution of any item on your planogram. Similar to the DotActiv Product Report in its presentation, it appears above your planogram.
How do you set up and use the DotActiv Analysis Grid?
After opening up DotActiv software and choosing the planogram you want to work on, you can find the Analysis Grid function in the ‘Tools’ tab in the ‘Planogram Analysis’ section. It is labelled as ‘Grid’, positioned next to the ‘Live Graphs’ function.
As with the Live Graphs function, if you have not worked with this function before, you will need to set up the prerequisites.
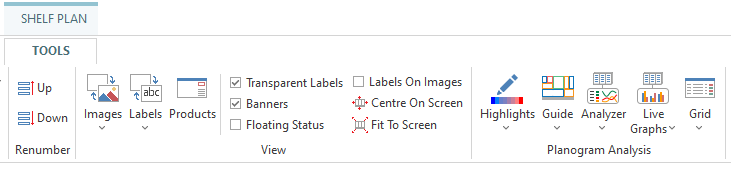
Locate the Grid function in the Planogram Analysis section in DotActiv
First up is your KPIs. After selecting ‘KPI’ from the dropdown menu under the ‘Grid’ icon, the ‘Planogram Analyzer Setup’ window appears. Here, you can select from a range of fields, depending on what you want to analyse.
A few KPIs include the popular ones like % Sales, % Units, % Cubic, % Facings, and DOS. You can also analyse the trading density of your shelf, do a plano range count, understand your stock turns and more.
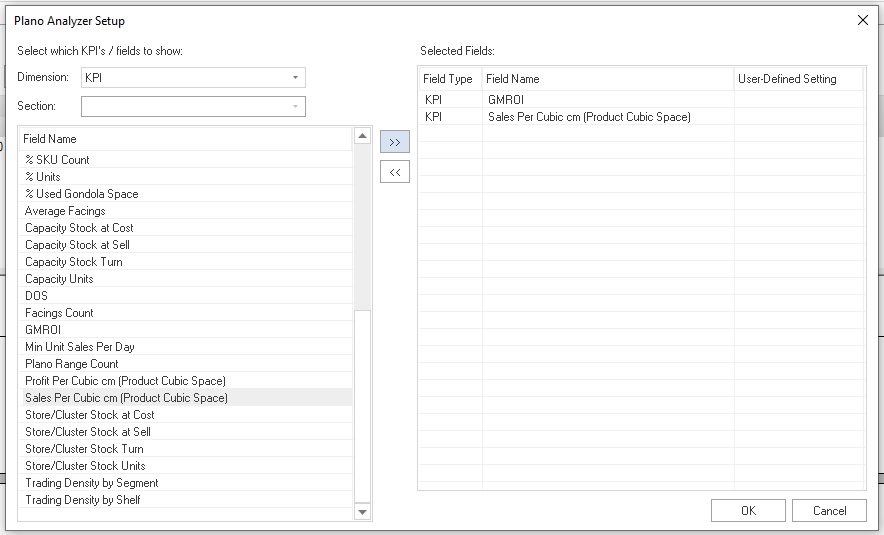
Choosing KPIs in the Plano Analyzer Setup in DotActiv
There is no limit to how many fields you want to add to analyse. You can add or remove KPIs to your analysis Grid by selecting them in the left-hand column and clicking on the directional arrows button in the middle of the window.
If you want to remove any KPIs from your analysis grid, click on the opposite directional arrows button.
Once satisfied, you can click ‘OK’.
Next up is your Hierarchy, where you can input all the information that you want to analyse. The default is Sub Category and Brand. If you want to make any changes - like adding Segment and Sub Segment, you’re welcome to do so by configuring it in the Hierarchy Field Selection window. Otherwise, you can leave it as default. It is also worth noting that the ordering of your configured fields is critical as it dictates the structure to analyse your grid rows.
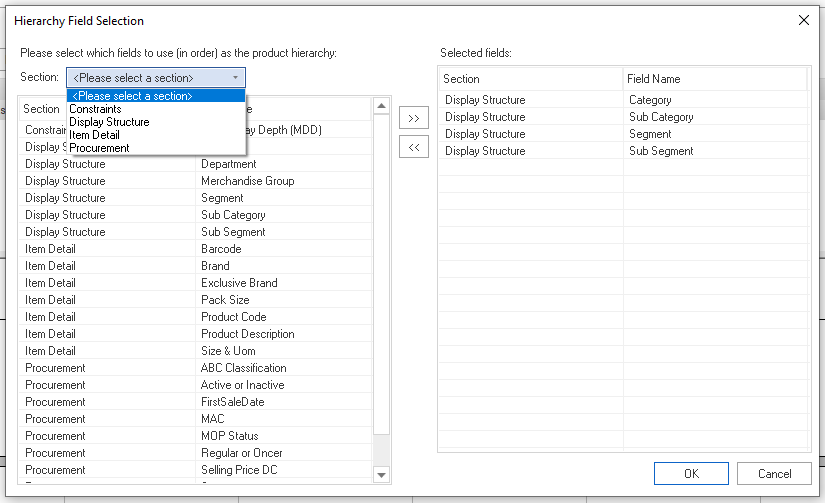
Hierarchy Field Selection window in DotActiv
To access your analysis Grid, click on the ‘Grid’ icon. As seen below, doing so opens up the Grid in a dockable window above your planogram where you can click through your various fields. By default, it opens it in your Hierarchy View.
Planogram Analysis Grid in DotActiv
In the columns on the left, you have your Production Information while on the right, you have your KPIs. You can also drill down into your hierarchy by clicking on the arrows in the ‘Product Level’ column.
In the above example, we chose the Cereals category. By clicking on ‘Cereals Cold’ or ‘Cereals Hot’, we can find out how much each brand contributed. That’s according to Sales, % Sales, Units, % Units, Profit, % Product and more. Similar to the Product Report, clicking on any product on the planogram will highlight the item in the dockable window.
You can also check out the Fixture View. Here, you can select the various segments on your planogram to understand how much each is contributing. Drilling into Segment 2 in the above GIF, for example, shows you how much Shelf 7 to 12 contribute.
If you were to compare Segment 1 to Segment 2, you can see that the first segment is slightly ahead in sales. Then, if you drill into the data, you can see that the least amount of sales in Segment 2 are from Shelf 7 while the two most sales are coming from Shelf 8 and 9.
When selecting rows on the grid, you will also highlight the related objects on the shelf, thereby making it easy to pinpoint the spread of products in a specific grouping.
If you need to add new data to your planogram, you can click on the ‘Refresh’ button. Doing so repopulates the grid with up-to-date information.
Conclusion
DotActiv's Live Graphs and Grid functions are just two of many that can help you to be more efficient and effective when building data-driven planograms.
Do you need assistance with a planogram software solution or require services? Visit our online store here for more information or book a custom exploratory consultation here.
