
Have you ever noticed empty shelves in a pharmaceutical retailer and then instantly began wondering why there is no inventory available? Or even whether the pharmaceutical retailer might be going out of business? Inventory management or stock control is a crucial aspect of running a stable pharmaceutical retail business.
On the contrary, when a pharmaceutical retailer disregards the significance of stock control, the growth of the business will be limited, the stability of the business will be compromised, and the public image of the retailer potentially scarred.

You can use data-driven planograms to help with stock control
Building planograms based on factual data allows products and brands to be merchandised with great accuracy. Data-driven planograms help ensure efficiency in the movement of stock to shelves and, finally, from shelves into the consumer’s shopping basket.
By importing data into your planograms, various data fields will be available and will allow you to identify growth opportunities and control certain variables. In this instance, significant data fields are Sales, Days of Supply (DOS), Actual Facings, and Weekly Movement.
Furthermore, your planograms need to be data-driven to definitively account for consumer demand and balance the DOS. This makes the shelf replenishment cycle much easier, resulting in reduced out of stocks, optimized stock rotation, and increased inventory control.
For example, fast-moving products would have a low DOS and would potentially require a higher number of actual facings to accommodate consumer demand. Whereas, a slow-selling product should have fewer facings as the amount of stock on the shelf will sell out slower. It would then be wise for you to have more stock on hand of the fast-moving product, than for the slow-mover.
By having higher quantities of stock available for fast-moving, lower DOS products, you will be able to replenish shelves in time and always have products available for the customer to purchase.

You can use DOS to help with stock control
For this article, we will mainly be focusing on the significance of a product’s DOS. The DOS of a product refers to the number of days that the stock of the relevant product will be on the shelf before all units are sold out.
For example, product X has a DOS of 15 days and a total of 20 products on the shelf. This would then mean that all 20 products on the shelf will be sold out within the next 15 days. The pharmacy retailer should then account for a full replenishment of the product every 15 days. It’s crucial for the pharmacy retailer to also consider the lead time of stock orders.
Additionally, through data-driven planograms, the DOS of each product will guide the space planner in allocating facings to each product. Lower DOS will result in the product being sold out faster and would thus require a higher number of facings.
By not taking DOS into account, you could find yourself overcompensating with your stock holding, running out of stock, and potentially misaligning with your budget. These consequences will all leave you vulnerable to not being able to meet customer demand and potentially damaging your reputation.
The relevance of DOS and actual facings are quite remarkable. These coinciding factors can be used to ultimately manage inventory and practice a higher control over stock orders for stores.

You can use planograms to feed into the Forecasting & Replenishment team
The Forecasting and Replenishment (F&R) team is a crucial function between DotActiv and the pharmaceutical retailer. F&R uses intricate systems to order and allocate stock to each store. By making use of the data found within data-driven planograms, this F&R process can be optimally simplified.
Specific data fields are required to collaborate with the F&R team of a pharmacy retailer in the below format. Examples of the data fields are store detail, product detail, and the number of facings of a product.
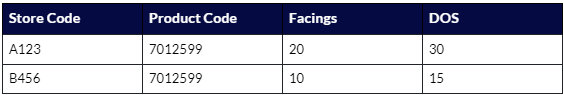
Based on the above example, F&R will know that store A123 will need 20 units of the relevant product to keep the shelf full. Whereas, store B456 will only need 10. The difference between these quantities could be linked to the fact that these two stores receive different planograms due to space restrictions or falling into different clusters.
Likewise, F&R will also know that store A123 will need to replenish its stock on the shelf every 30 days and store B456 every 15 days. Enough stock will then be ordered to compensate for this irregularity in DOS.

You can use planograms to maintain stock control
With regards to this article, data-driven planograms are not only able to assist with controlling stock and inventory but also allow you to maintain these levels.
On DotActiv’s suggestion, each category found in a pharmacy retailer is refreshed a few times throughout the year. The refresh period of a category is influenced by factors such as innovation, seasonality, as well as the category’s roles and strategies.
Refreshing a category is the process of adding newly listed lines to a planogram and removing the lines that have been discontinued. With this in mind, the refresh process will affect the composition of products found in the planogram each time. Thus, you must update the information that has been sent to F&R with each refresh.
For example, Category A is Seasonal and will be refreshed before the next season starts. The information depicted in the previously shown table will then have to be updated and resent to F&R with the change of the season. Category B, meanwhile, is a low innovation category and few new products are listed throughout the year. It would then be suggested that the category is refreshed semi-annually, or merely annually. This would result in the information having to be resent to F&R either every 6 or 12 months.
By updating the information in the table sent to F&R, the stock ordered for new products can be accounted for, as well as stock orders being canceled for products that have been discontinued.
If this process is not followed, the stock ordered by F&R for each store will be inaccurate and DC stock of newly listed products will not be sent to stores. This could result in dormant stock and financial loss.
Conclusion
Although a pharmacy retailer might already have an F&R function to manage and order stock for each store, data-driven planograms are an assistive measure for more efficient and accurate stock orders. Aligning inventory and stock orders with the data-driven planogram will result in both functions being implemented more efficiently.
Are you interested in finding out more? Book a demo with a DotActiv expert and we can show you how our software can help you improve and maintain your stock control.