
While planograms have been around for a long time, the ability to automatically create them hasn’t. Planogram automation is the latest tool in a space planner’s toolkit, and it will save them plenty of time to focus on helping your retail business.
Besides giving them more time to analyze a planogram and ensure it’s 100% accurate, they’ll have more time to work on assortment planning among other things. They’ll also be way more productive.
We’ve written about how retail analytics can improve assortment planning. We’ve also touched on how it can help you create better price points. But what about Retail analytics and data and the effect on building, analyzing, and communicating planograms?
The importance of data for your planogram
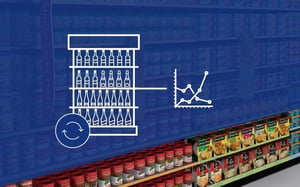
Considering that Planograms are one part logic and aesthetic appeal and one part data, the role that data plays in planograms should never be underestimated.
Data is beyond crucial.
Without data, you don’t have a planogram. Or at least you’ll have one, but it will be nothing more than a generic, lifeless diagram of what a buyer or supplier would want the layout to look like. That won’t help you make better decisions for your retail business.
However, with data at your disposal, your planogram will come alive, to show you exactly where you are performing, where you are weak, and how you can improve.
Reasons why data is so crucial to building and analyzing planograms
It’s one thing to say that data is crucial to building a planogram, and another to show why data is so crucial.
As stated above, data will bring your planogram to life. Below are three ways it can do just that:
1. Shelf performance analysis
To understand how a category is performing, you need to be able to analyze performance concerning space allocations, which would be impossible without data.
You can increase your sales by allowing more space for good products and less space for bad products. Without data, there is no telling which products on your shelf provide you the most (or least) sales.
2. Shelf replenishment
Knowing your gondola’s Days of Supply (DOS) is crucial as all of your products on the shelf need to decrease at the same time.
At the same time, you can increase your profits by putting high-profit margin products at eye-level, which is the most lucrative product positioning. Without data, you won’t know which products are most in demand, so you won’t know what should be placed in the best locations in your store/s.
3. Stock replenishment
Stock needs to be continually ordered to ensure that shelves appear fully stocked. Without data, not knowing what needs to be ordered will severely impact your sales and profit margin going forward.
Considering that space planners have to regularly update planograms with new sales data, which will result in changes to product space allocation, in replenishing your stock, you can optimize your product and store performance. There is also the bonus that preventing out of stocks will also help you increase your sales.
Reasons why retail analytics is so crucial to communicating planograms
Besides the reasons why data is crucial to a planogram, it is just as crucial to communicate how a planogram is generated. After all, you can’t simply generate a planogram without explaining why you’re creating it.
1. It can help space planners flaunt the true value of a planogram
The best way of persuading anyone of anything is to back up any argument you make with tangible data.
The same is true with communicating the value of well-built planograms.
When it comes to explaining why a planogram should be generated in a particular way, data plays a key role in backing up any debate that a space planner may have with you, the retailer.
Instead of telling you how a planogram should be organized because the space planner thinks it will look visually appealing, they have compelling data to back their reasoning.
For example, Product A should be given more facings on a planogram? Why? Well, here’s the data to back it up: It’s making up 40% of your overall sales. As a retailer, you can’t argue with that.
2. It can help suppliers hold a compelling debate with their retail customer
As a supplier, if you are a category captain, you have the responsibility of deciding which products should be placed on the shelf of your category. You’re also responsible for planning and developing planograms.
That being said, you need to have a compelling argument about why a planogram should look a certain way. This is where Retail Analytics can help you.
With data in tow, any conversation you have as a supplier with your retail customer will be that much easier to have. It’ll further emphasize that you have their best interests at heart.
A bonus is that the relationship that you have built up with your retailer customer will be that much stronger.
Free Ebook: Download Your Copy of Our Definitive Guide To Retail Analytics Here.
Conclusion
Data should not be taken for granted. With it, you can create a planogram that works for your retail business. And gives your customers what they want and need. Without data, you’ll struggle to even compete against your fellow retailers.
