

Cluster mapping helps you understand the geographic spread of your clusters and concerns your cluster input variables and the external environment. That sounds like a mouthful, and we're aware of that. So let's focus on what it means. Cluster mapping gives you in-depth insights and a visual representation of your store groupings to help you make informed strategic decisions.

That answers the question of why. Why should you consider completing a cluster mapping exercise? Of course, there is more to it than written above, so we unpacked it further in this article. That includes unpacking who should consider completing this.
But how? That’s where we recommend specialized category management software such as DotActiv. In this case, it's our Enterprise solution because it isn’t an exercise you can complete manually and expect to see accurate results.
If you're unsure of clustering or if it appears complex, we also have dedicated professionals who help deliver our category management services, which include cluster optimization.

What is cluster mapping?
Before learning who should complete a cluster mapping exercise and how you can do that, it's worth unpacking what we mean when we mention this topic.

The cluster mapping process usually takes place after completing a cluster analysis. Doing so helps you see which stores fall into each cluster and their location if compared to each other. You manually plot them onto a map or use specialized software for a more accurate, responsive, and interactive analysis.
There are also benefits associated with cluster mapping.
- It measures your category-based clusters' presence, size, and performance over a specific region.
- It provides insights into the geography of your stores within your clusters, allowing you to compare other cluster analysis inputs.
- It explains the impact or significance of relationships between local environments and clusters.
We do want to point out that cluster mapping doesn’t describe the dynamics and patterns within each cluster. For that, you need to consider the cluster profiling process.

Who should complete a cluster mapping exercise?
Completing a cluster mapping exercise is one that you can do regardless of if you’re a retailer or a supplier.
Cluster mapping for retailers
If you’re a retailer and want to assess and understand the distribution of your stores across their geographical reach, it's worth completing a cluster mapping exercise.
By doing so, you can make more informed decisions - all based on data - that impact your product assortment, new store ventures, and market opportunities. That means you can meet the ever-changing demands of your customers while providing a great shopping experience.
Cluster mapping for suppliers
We recommend completing an exercise if you're a supplier because it visually shows you the retailers you supply and their location. This practice allows you to understand which retail stores fall within which cluster.
Let's say, for example, you're a liquor supplier and provide products to various food retailers in different regions of the country.
In this case, store branches from various retailers may fall within the same cluster because they have similar locations, performance data, or shopper purchasing patterns. A map depicting each store and location helps you better understand that.
That also means role players across retailers and suppliers must understand how the process works and any cluster analysis results.
Visually plotting each cluster on a map means all relevant stakeholders can answer the following questions:
- What are clusters?
- Why are certain stores grouped?
- What makes one cluster different from another?
Once you understand the basics of cluster analysis, it's easier to use cluster mapping for in-depth analysis, which assists each role player in their function.

How do you complete clustering in DotActiv?
1. Completing clustering in DotActiv software
At DotActiv, our software provides a Cluster Optimizer feature that allows you to map existing or new clusters.
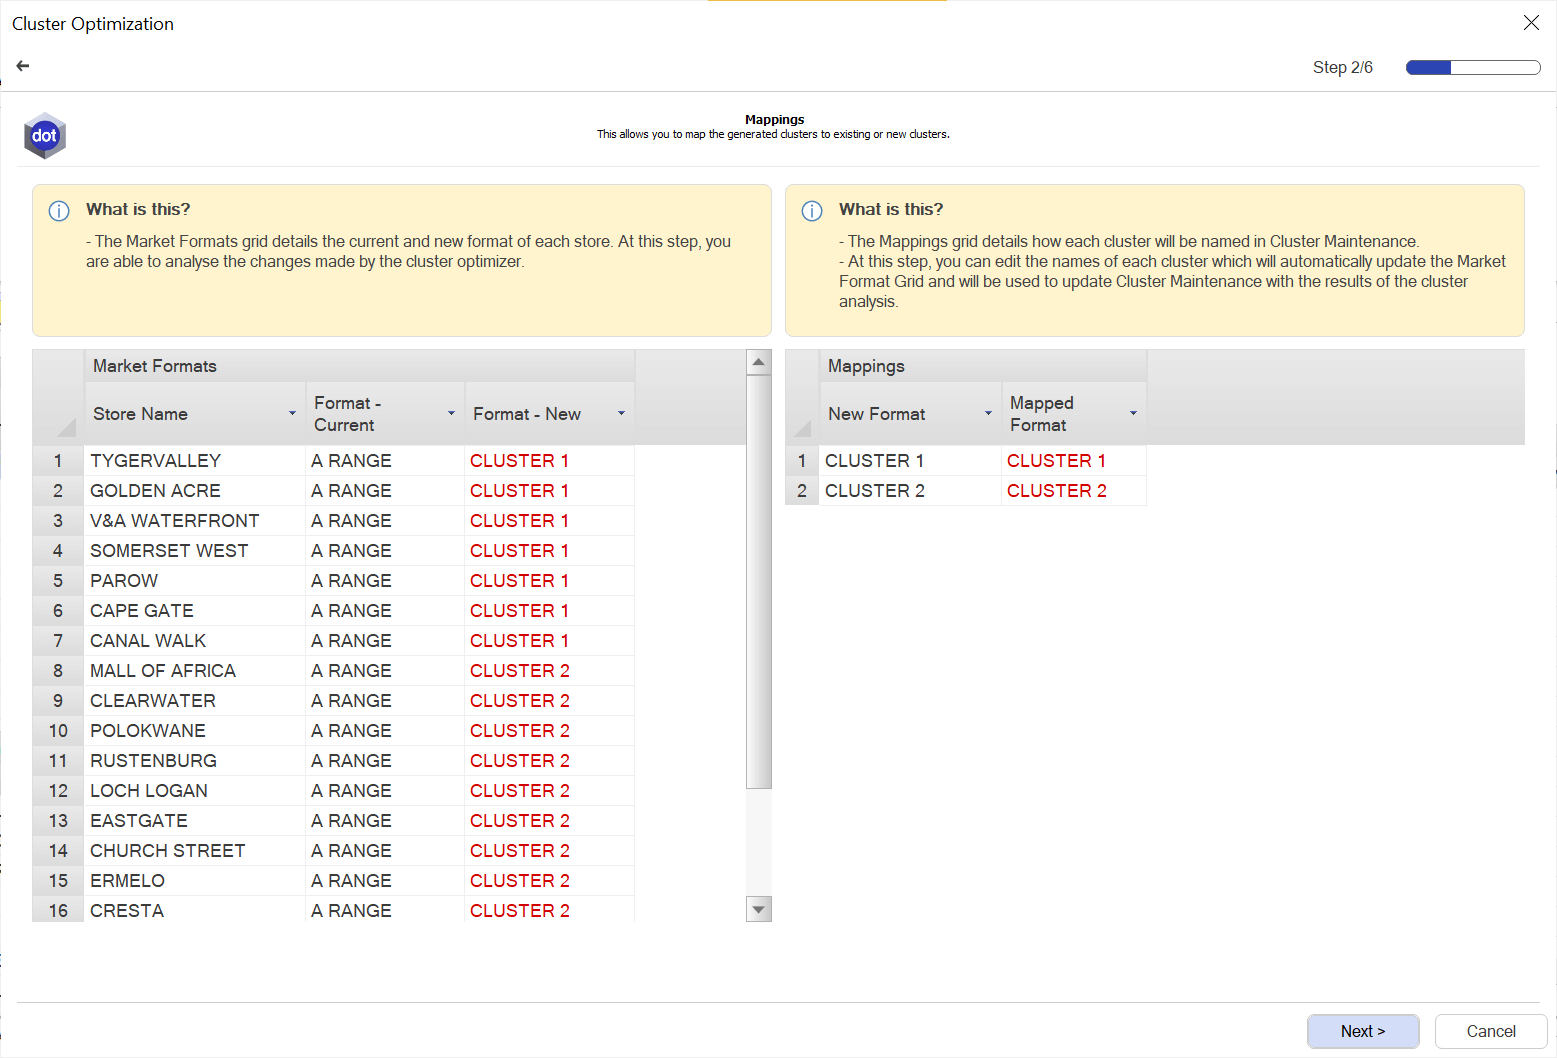
In the Cluster Optimizer feature, seen above, the Market Formats grid (on the left) details the old and new clusters of stores. The Mapping grid (on the right) shows the name of each cluster in Cluster Maintenance. Editing the names of each cluster updates the Market Formats grid for the affected stores automatically. It will use these names to update Cluster Maintenance with the cluster analysis results.
So how can you benefit from using DotActiv software to create clusters?
The Cluster Optimizer feature within the DotActiv software uses unsupervised machine learning to find similarities in category data and group stores efficiently. The algorithm calculates the ideal number of clusters and decides which stores to locate where for a particular product category.
Using an algorithm to optimize your clusters means the DotActiv software can test all possible cluster variations and recommend the best one for the product category.
The process leads to:
- Increased turnover,
- Improved customer satisfaction,
- Lower inventory costs, and
- Better in-store experiences.
However, it’s critical to note that database integration is necessary to benefit fully.
We also have two different types of integration, one-way and two-way, the second of which we recommend if you plan to use DotActiv to map clusters for your retail business.
With one-way integration, we import retail data from your data source (Sales Database, ERP, SAP, and so on) into the DotActiv database structure hosted on a SQL server. We import this data in a specific format based on staging tables. Doing so allows anyone involved to analyze, report, range, cluster, create floor plans and planograms, and use all the DotActiv software features.
Two-way integration includes all of the steps detailed for one-way integration. But, instead of feeding data back into the DotActiv database, the causal data, with value-added from planogram generation, ranging, and clustering, is scripted back into the database and exported through Export Staging Tables. The information in the Export Staging Tables feeds into your replenishment cycles. It could include ranging information, product status information, updated or corrected values for any of the feeds, stock information for replenishment engines, or additional values calculated on our side per your wishes.
We can export these for you to receive and ingest into the original systems on your side.
While one-way integration is a gateway into an automated system that eliminates human intervention when communicating data from the client into the DotActiv database, you need two-way integration for the cycle to be automated and completed.
2. Diagnosing clustering problems with DotActiv software
Clustering helps you by providing valuable insights and enables you to make informed decisions regarding store locations, product assortments, and targeted marketing strategies.
By analyzing customer data and identifying patterns, clustering helps you group similar customers based on demographics, purchasing behavior, or preferences. It allows you to create tailored marketing campaigns, optimize product placements, and customize your offerings to specific customer segments.
Clustering also aids in identifying untapped market opportunities, optimizing inventory management, and improving overall customer satisfaction and loyalty.
So how can you tell if a clustering problem exists using DotActiv software?
For that, you have the Cluster Plan Delivery Report.
Store Composition per Cluster: It indicates the percentage of stores that make up your clusters. The graph notifies you whether or not you should cluster. If one specific cluster makes up most of the stores, it might indicate that clustering isn’t necessary. If there is an even split of the stores between clusters, there is a good reason to cluster.
Sales Display Hierarchy Contribution per Cluster: It indicates which clusters spend more money on specific sub-categories. You can click on a sub-category to drill into it and gain more information on spending habits at a segment level. If the sub-category level didn’t show differences between the clusters, digging into the segment level might show the differences.
Units Display Hierarchy Contribution per Cluster: It indicates how your different clusters shop with regard to the quantities they buy. As with the previous graph, you can drill into the sub-categories to see the difference in units purchased in your different clusters and see if there are any trends. It is more likely to be evenly spread if you cluster based on LSM, and more likely to be different if you group based on store size.
Store Profile Composition per Cluster: This graph is useful if you cluster based on LSM and allows you to determine your clusters. It indicates which stores (based on profile) fall in your specific clusters, and if there is a clear difference in-store profile among clusters. It assists you in deciding to cluster a category where the Average Linkage isn’t high, but you see a difference in consumer habits based on store profile.
Brand Profile Composition per Cluster: This graph assists you to analyze the different brand profiles in each cluster. If you drill into every brand profile, you can see what brands form part of this specific brand profile and how much each cluster prefers this brand. You can analyze sales, quantity, and gross profit for each brand in each cluster. This graph is also critical when ranging, as it assists you in seeing if you should remove brands from a range in a specific cluster.
After analyzing all these graphs, along with the Silhouette Coefficient and Linkage Distance, you can determine if it is necessary to cluster a category.
As for implementing this software function, there are numerous steps. The first step involves looking at the generated cluster grid.
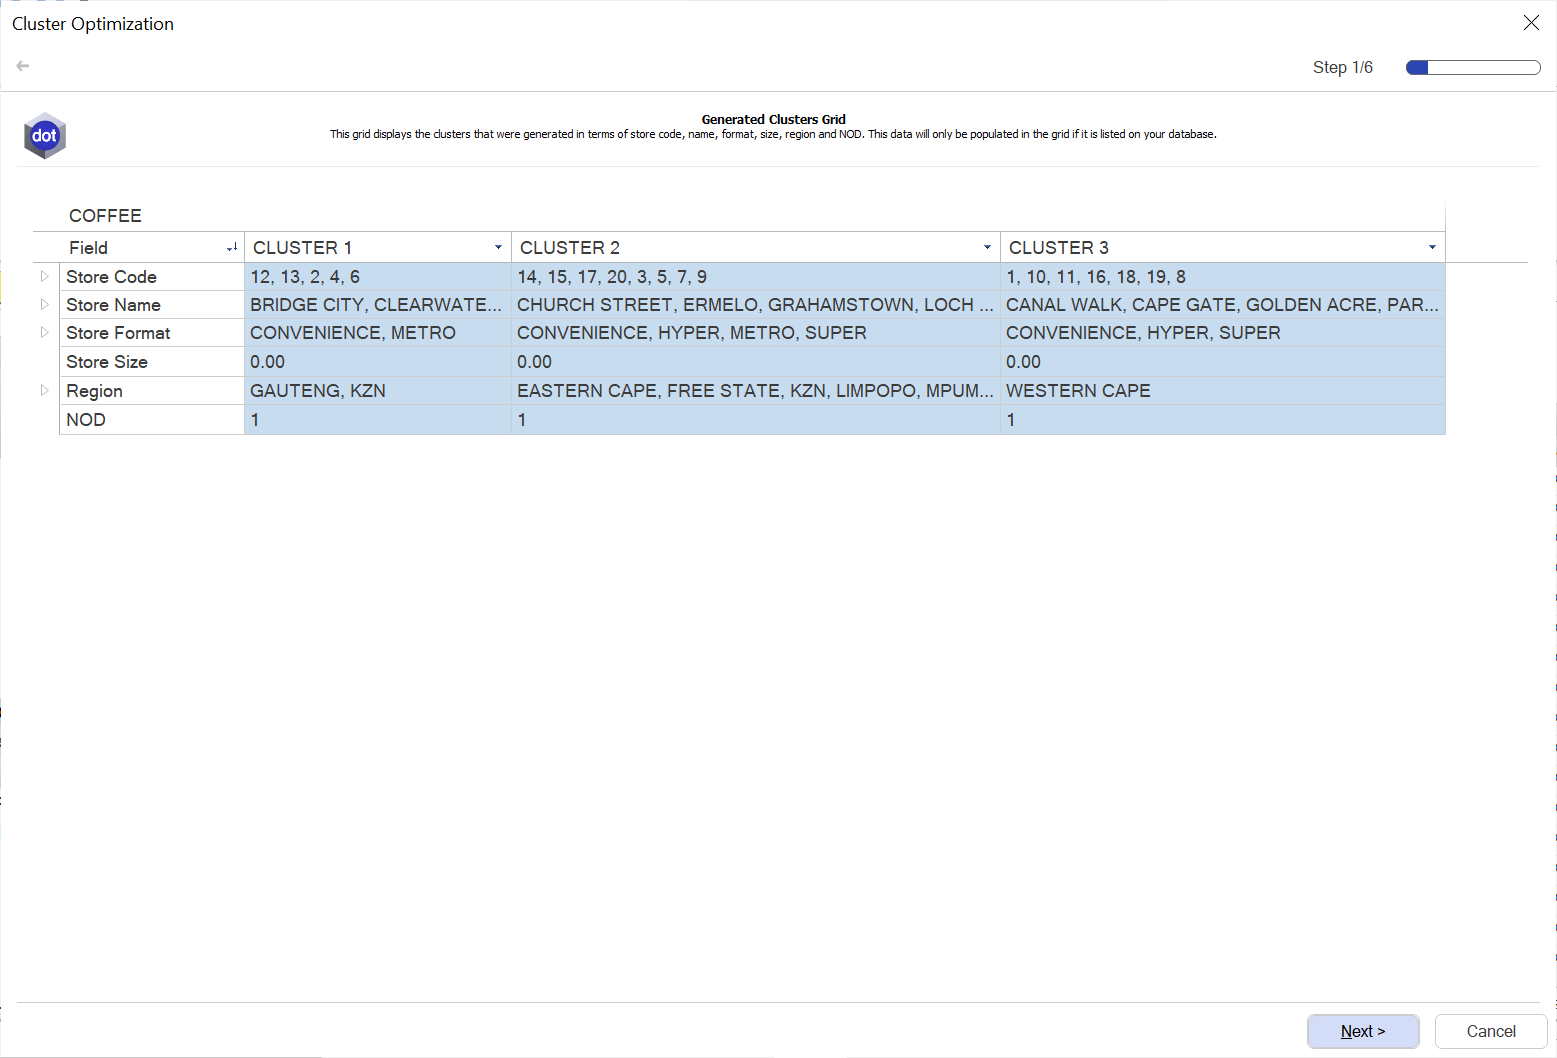
It's critical to note the number of clusters the DotActiv software suggests you follow by checking the number of stores it has put into each cluster. This eliminates the possibility of having a cluster for a small number of stores. You then look at your store sizes within the clusters to assess the profiles of the store that ties in with the region. The ability to see which stores in a specific region fall into which clusters allows you to classify them as premium, mid-tier, economy, or low-economy stores.
Lastly, the generated clusters grid also provides the NOD suggested per cluster, allowing you to pre-analyze the planograms you will need to build or assign to that specific cluster.
Then there is the Silhouette Coefficient, a method used to help validate the consistency between clusters and their compactness. With the graph, you can determine the number of clusters that best suit the category, the range, and shopping behaviors.
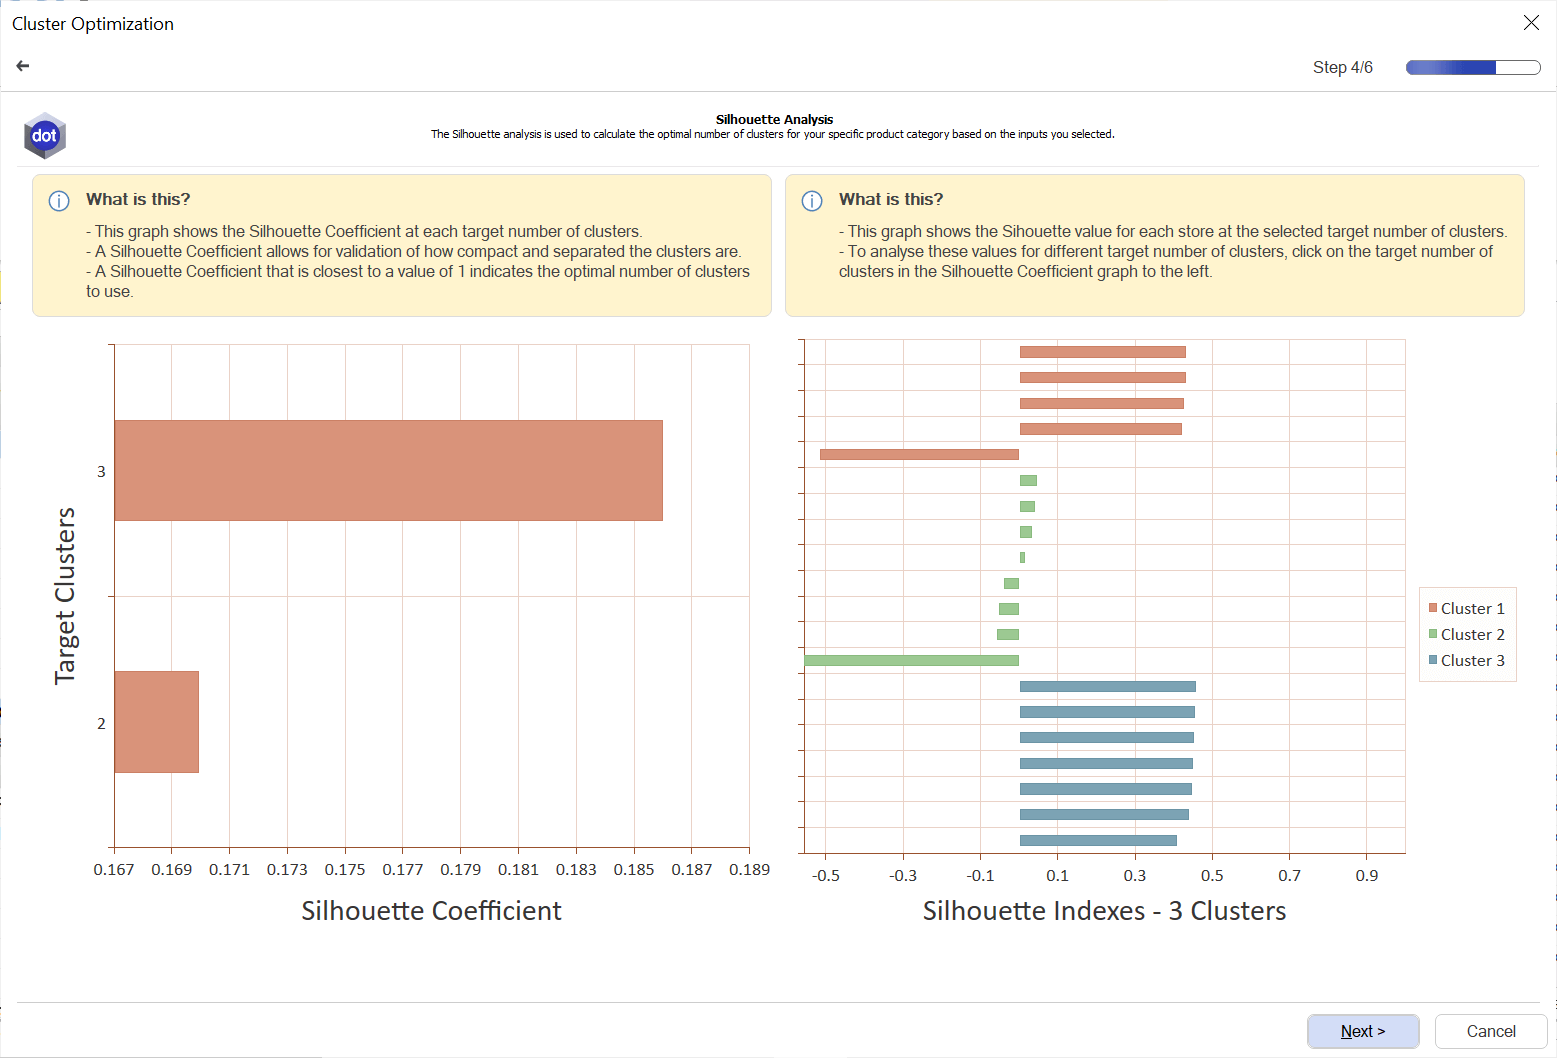
The score ranges between -1 and 1. The bar closest to 1 is the most optimal number of clusters.
A score of 1 means the clusters are separated from each other and have definite differences. A score of 0 or negative means there are similarities with no distinct consumer preferences. It means that you should use manual intervention to cluster or not.
The Linkage Distance determines the significance of the differences between the pre-determined clusters as established by the DotActiv software. DotActiv stipulates that the first sign of the need for clustering is that the average metric has a greater than 16% difference.
At DotActiv, we use 16% because it is considered the point of significance and is where the clusters are diverse enough for clustering to be worth your time and effort.
Here you compare the various linkage distances between the cluster combinations and determine if there is a significant enough difference to recommend clustering.
Ensure you compare all the suggested clusters with one another since there may be instances where the percentage linkage distances might indicate similarities and that combining them might be more effective and efficient than attempting to separate them.
The software uses these metrics to measure the physical distance between two stores (called points). The larger the percentage between clusters, the more significant the distance, and thus, the clusters are more diverse, which suggests a greater need for clustering.
3. Delivering impact with DotActiv's Cluster Optimization service
At this point, you might be overwhelmed by the sheer amount of information on what goes into effective clustering. There is no shame in acknowledging that. It’s why we have a category management service that speaks directly to clustering.
It’s our Cluster Optimization service and you’re the ideal customer if:
- You want to analyze large amounts of data effectively;
- You want to understand your target market within and between clusters
- You want to improve the efficiency of your assortment planning and planogram development processes.
You begin clustering after identifying stores with similar consumer behavior and purchasing patterns. However, we recommend you start with clustering once you have more than 15 stores. Why? Because, at this point, creating store-specific assortment and shelf plans becomes impractical, and a mass-market approach becomes too generic.
Before we unpack the process we follow to help you, it’s worth considering the circumstances that could prevent or hamper your clustering efforts.
Insufficient or poor-quality data
You require enough reliable data to find patterns, and if the data is incomplete, incorrect, or of poor quality, clustering will provide inaccurate results. You should make sure your data is complete, up-to-date, and clean.
Biased results
Focusing too much on one factor or variable for clustering can lead to biased results. To depict the complexity of the retail environment, you should consider multiple variables and how they interact.
A lack of knowledge or expertise
The cluster analysis process requires statistical knowledge, expertise in the retail industry, and an understanding of the context. Without expertise in data analysis or retail knowledge, the results can be misinterpreted or not utilized effectively.
Fortunately, DotActiv provides a combination of 20 years of experience and knowledge on this topic. We have trained category planners who take you through the steps and guide you toward the most optimal cluster setup based on experience. DotActiv also has the expertise and training to spot specific trends and opportunities.
We follow a set process that allows us to deliver an effective clustering solution. Below is a high-level view of a few (not all) steps we follow.
- Step 1: We define your objectives by determining what you want to learn or achieve through clustering.
- Step 2: We collect the necessary data and prepare it before choosing the important and relevant variables to your retail goals.
- Step 3: We choose a clustering algorithm that aligns with your data and objectives.
- Step 4: We help you determine the number of clusters before conducting cluster analysis and evaluate the results.
We monitor and keep track of cluster performance over time. DotActiv supports ongoing clustering analysis and provides tools for updating and refining clusters as needed.

Conclusion
Building clusters for your category and ensuring you cater to the needs of your customers is possible with an all-in-one category management solution from DotActiv. That includes if you purchase our Enterprise software edition or rely on our professional category management services.
To discuss your unique requirements and how a DotActiv solution can help you achieve your clustering objectives and goals, book a complimentary meeting with a DotActiv expert here. Alternatively, browse our software options on our online store here.
