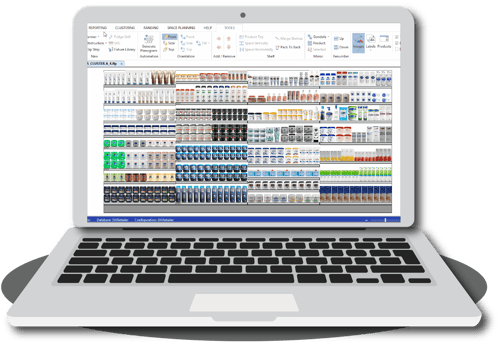
Skip to content
planogram_pillar_page_hero

Planogram

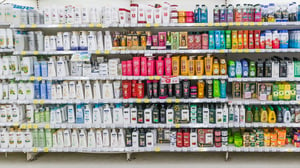
A planogram is a diagram, drawing or visual representation that indicates how and where to place products on a shelf.

Built using retail data such as sales, units, SKU and fixture information and more, retailers and suppliers use planograms to plan, communicate, implement and maintain their merchandising strategies.

TABLE OF CONTENTS

WHAT IS A PLANOGRAM?

What is a Planogram?

A planogram is generated based on the performance of a set of items within a particular category of products to promote on-shelf efficiency in respect of stock cover by assessing product and brand positioning and visual impact.

Is there another name for it? Yes, they are often called plan-o-grams, shelf space plans, space plans, schematics or POG’s.

WHAT IS THE PURPOSE OF A PLANOGRAM?

What is the Purpose of a Planogram?

A planogram is a visual representation used to plan, communicate, implement and maintain a retailer’s merchandising strategy. It’s a model or diagram that describes the placement and positioning of retail products on shelves, as well as the number of facings allocated to each product.

Facings refer to a row of products. For example, three rows of items refer to three facings. Usually your best-selling and most-profitable products will receive the most number of facings.

It gives your executive management or head office more control over how products are displayed and implemented in stores and allows you to maintain and review shelf layouts based on the performance and success of the planograms.

WHAT IS THE END GOAL OF A PLANOGRAM?

The end goal of a planogram is to increase your sales and profitability by ensuring that your shelf displays offer the right selection of products to reach your shoppers at the right place and time.

Facing allocations can be updated with seasons, special events and new assortments. Planograms also help your merchandisers to place products in a logical shopper-friendly fashion. Doing so improves the overall shopping experience of your customers in your store.

WHEN ARE PLANOGRAMS DESIGNED?

When are Planograms Designed?


Planograms are designed a month or two before implementation. You must design them or redesign when:

WHAT IS THE HISTORY OF PLANOGRAMS?

Retailers first started using planograms due to increasing competition in the marketplace. As the retail environment expanded, category management evolved, which meant there was a need for retailers to adapt their merchandising strategy to remain relevant in the market and stay ahead of the competition.

Due to changing customer expectations, it was vital for the retailer to understand how and why the customer was shopping. They also needed to know how to translate what they found into a visual form of merchandising that would be appealing. Retailers also saw a greater need for a shelf planning tool to better measure, monitor and control sales performance. Such a tool could also provide a clearer understanding of the profits or losses encountered.

So retailers started drawing up plans for their shelves to improve the in-store presentation and differentiate themselves from their competitors by offering a different assortment to their customers. It also allowed retail groups to create consistency across their stores and improve stock control by better planning their shelves. As information technology evolved, Planogram Software solutions developed and could support planograms, generating further information on sales that could be easily read and understood.

Want to build the best planograms possible?


Learn all there is to know about what goes into performance-enhancing planograms and how

they can help you increase your sales and meet consumer demand in this free ebook.

Download The Ebook

WHO CREATES PLANOGRAMS?

RETAILERS

Planograms help you to dictate your store layouts. They also serve as an opportunity for you to make the shopping experience consistent throughout your retail stores.  
The end goal for you as a retailer is to create a planogram that can help you respond better to customer expectations through optimised assortments and logical product flowsincrease stock control; improve shelf displays and visual impact. Planograms also allow for an increase in the profitability and financial performance of your stores.

SUPPLIERS

1. BRAND AND CATEGORY VISION

As a supplier, you can use planograms to provide recommended layouts to retailers. You can also use them to create consistency for categories and ensure the correct flow of products for the brands according to the strategy and vision.


2. SPACE ALLOCATION

You can use planograms backed with data to ensure that your brands and competing brands are attributed fair space allocation.


3.  COLLABORATION

Usually, a retailer assigns a brand leader or “Category Captain” for each category. That is to help them determine the flow of the category, understand what products are complementary and what space to allocate to each brand. This step involves data sharing between the retailer and category captain.

For example, you can buy market data and flush this data into your planograms to spot market opportunities. Taking advantage of opportunity gaps often comes in the form of allocating additional space to a particular brand, new line introductions and ordering stock.


4. NEW PRODUCT DEVELOPMENT

Having the ability to adjust your products dimensions in real-time before producing it enables you to achieve optimal product dimensions for the best stock holding ability on the shelf.


5.  STOCK CONTROL

Planograms help you determine the right amount of stock to send to a store according to the shelf space allocated to each product.


6. MONITORING SHELF ALLOCATION

Is your brand growing within the retailer? If a brand isn’t performing very well, planograms can be used as a solution to showcase new strategies or flows that may help the category grow as a whole.

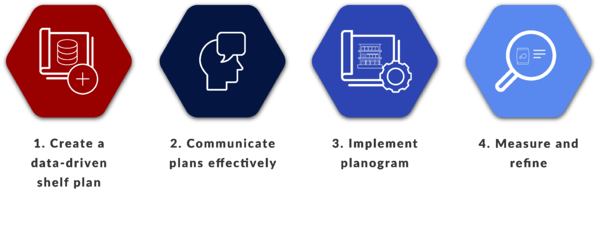
BUILDING A PLANOGRAM: THE PROCESS

You can improve the shopping experience and financial performance of your stores through proper merchandising. To do this, you can use planograms since they are one of the best ways to plan, communicate, implement and maintain a merchandising strategy.

Below is an overview of the process you need to take to implement and maintain successful planograms:


Building a Planogram: The Process

STEP 1: CREATE A DATA-DRIVEN SHELF PLAN

A data source is primarily a location from which you use data. Better still, it’s a collection of records that store data that you can use at a later date.


STEP 2: COMMUNICATE PLANS EFFECTIVELY

Planograms dictate to your floor staff where to place products in relation to each other, how many facings they should get, and which shelves they should go on. It removes the human margin for error and gives you more control when implementing your merchandising strategy.


STEP 3: IMPLEMENT PLANOGRAM

Data-driven planograms help reduce stock holdings and make it easier and faster for your shelf packers to position products on your shelf. Staff that implement planograms are also more aware of where everything is in-store. That makes them more capable of assisting you with questions regarding product options and locations.


STEP 4: MEASURE AND REFINE

By analysing sales patterns and product performance, space planners can recommend how many facings each product should receive. It enables you to meet the demand of your customers. You can follow the trends within a specific market or even branch out into similar or new markets.

This continuous redesigning means that you need to continually refine your space allocations for optimised sales, inventory control and consumer satisfaction.


WHAT DATA DO YOU NEED?

Planograms require product information to draw up a visual representation of the shelf and determine product space allocation and positioning.

This data may include:

SALES DATA

To create the best possible planogram, a space planner needs to pair everything they know about a product with sales data for the category. That includes monetary sales and the number of units sold over a specific period.

Sales history also provides information about the product. That includes whether the product is seasonally purchased or frequently purchased. External market data can complement internal sales data.

A CATEGORY HIERARCHY

Aligning internally around the role of a category can be very useful to understand how a consumer behaves and will affect the positioning of products on a shelf.

There are four major consumer-based category roles: Destination, Routine, Seasonal, and Convenience.

SKU INFORMATION

It includes product classifications, product images, dimensions, brand description, product status, display structure, and barcode.

A RANGE

A range is an assortment of products that matches the category.

PRODUCT ATTRIBUTES

Brand, Size, Colour, Function, Price.

These attributes will help you understand the consumer decision tree and shopping behaviour towards a particular category and help dictate the category strategy. For example, you can arrange products based on function and price.

Product knowledge and understanding the role of a product in a category will allow a retailer to create logical product flows (merchandising mix) that align with consumer behaviour and expectations.

FIXTURE INFORMATION

It includes fixture types (shelves, hanging bars, hanging pegs, baskets) and fixture dimensions (floor to shelf height, shelf height, width and depth).

WHY USE PLANOGRAMS?

Why Use Planograms?

There are a few reasons why you should use data-driven planograms. All of them revolve around these two objectives:

Firstly, data-driven planograms create a better shopping experience by meeting the demand and expectations of shoppers. Secondly, they improve the financial performance of the store.

That said, some of the major reasons for using planograms include:


1. SPACE ELASTIC DEMAND

The amount of space or facings allocated to a product has a significant impact on its sales. It is thus imperative to provide products that are both popular and profitable with enough space.

If the assortment is correct, then the shelf space allocated will return the highest profit (fast-moving products will be identified and allocated more shelf space).


2. CONSUMER BEHAVIOUR

Your customers make several decisions while they’re shopping, and an effective planogram can influence several of those decisions. Consumer Decision Trees are a tool for planogramming that map out their thought process when deciding what to purchase.

Developing planograms based on product performance and consumer decision trees in mind will help you to build optimised layouts that drive positive shopping behaviour.


3. STOCK CONTROL

Effective planograms ensure consistency of the days of supply for the products on a shelf. It makes the shelf replenishment cycle easier and results in decreased stock holding, reduced out of stocks, optimised stock rotation and increased inventory control.

For example, by using a product minimum display quantity, you can minimise the problem of running out of stock while also know when to place new orders.

Implementing data-driven planograms also helps you locate products that are selling well by comparing how much space each product receives versus how well they’re selling. By doing so, a space planner can attribute more facings to products that are performing well, which improves stock replenishment.


4. VISUAL APPEAL AND TACTICAL POSITIONING

Generating planograms that display products on the shelf in a visually appealing, logical and convenient way will help you attract and retain more shoppers.

Here are a few examples of tactics that you can use for positioning products on a shelf:

  • Eye-level positioning of profit generators (leading brands and best sellers);
  • Positioning of retail house brands next to the brand leader;
  • Packing products from smallest to largest;
  • Placing products on the shelves by price point, for example, premium to economy;
  • Placing products by latest technology;
  • Placing all product heights on the top shelves to be consistent;
  • Packing big or heavy items on the bottom shelves for easy access and convenience;
  • Making use of gondola ends for in-store promotions;
  • Emphasising best sellers by attributing more facings;
  • Creating incentives to trade-up higher margin products; and
  • Using brand blocking, colour blocking and vertical merchandising.


5. MAXIMISE SALES PER SQUARE METRE

By taking into account how many days it takes for a particular product to sell out, you can balance the space on the shelf to the sales of each product. If the product takes longer to run out, give it less space and allocate that space to a product that sells out faster.

In this way, you can increase your sales and profits.

WHAT MAKES A PLANOGRAM VALUABLE?

Planogram Data

DATA

Data is the most valuable element for a planogram as it houses all the information you require to fill the shelves correctly and provide the customers with what they want.

The data present within the four fundamental data fields - Market, Product, Period, and Fact - help you analyse and understand which products are growing. They also help you to learn which are stable and which need to be repositioned or replaced.

In essence, as much information as possible will help you to understand and reach their target shoppers.

Essential planogram data includes a range based on shopper behaviour, sales data for every SKU and LSM groupings, and stock control data metrics such as stock movement, days of supply and out of stocks.

PRACTICALITY

Practicality

A planogram is a critical management tool to make the shelf replenishment process easier. It also helps you communicate shelf layouts to your floor staff efficiently.

Practical advantages of planograms include:

  • Number of facings allocated to each SKU and product placement;
  • Attributing the right amount of space to each product according to sales;
  • The capacity to visualise and represent what each product category should look like; and
  • The visual presentation of live images and schematic reports.

REPORTING

Combined with accurate sales data, a planogram is a valuable tool for reporting.

Advantages of a planogram for reporting include:

  • The ability to measure success to refine the planogram;
  • Locating opportunity gaps;
  • Reporting on category performance in store (hot/cold products, top/bottom performers, slow movers); and
  • Data analysis (individual SKU/product analysis, contribution, forward share, days of supply, out of stocks).
Reporting

A MERCHANDISING STRATEGY

Merchandising Strategy

However critical data may be, it only becomes relevant when combined with the necessary understanding and support from you, the retailer, your buyers and any decision-makers to make strategic decisions to help the category grow.

Elements of a robust merchandising strategy include adopting a good understanding of the target shoppers and their expectations. It also includes having alignment around the category roles to improve the shopping experience and maximise the total basket profitability, retailer and supplier collaboration, a store and category clustering strategy, and a methodology for category management.

WHAT ARE THE SHORT-TERM BENEFITS OF PLANOGRAMS?

The short-term benefits of building and using data-driven planograms include:

  • Better space allocation and, therefore, immediate increase in sales;
  • Aesthetically pleasing displays that attract shoppers’ attention;
  • Maximising selling potential for every inch of shelf space;
  • Customers enjoy logical product flows that improve shopability for consumers; and
  • Reduced inventory holding and out of stocks.

Customers are more likely to return to your stores when they know where to find the product they are looking for, regardless of which branch they are visiting.

WHAT ARE THE LONG-TERM BENEFITS OF PLANOGRAMS?

Together with the above short-term benefits, there are also long-term benefits to building and using data-driven planograms. They include:

  • A better grasp of product and category performance;
  • Improved awareness of space value and space return;
  • Significant increase in sales and stock rotation;
  • Improved store consistency and shopper satisfaction; and
  • A simplified and optimised product replenishment.

LET DOTACTIV HELP YOU BRING YOUR CATEGORY PLANS TO LIFE

Increase your revenue by between 5% and 30% by giving your products data-driven space allocations and applying consistent merchandising principles across your stores.

With our category management services, you’ll get quick access to the expertise, software and process required to ensure you choose ideal category roles with matching category tactics reflected in your planograms.


Explore Services

DotActiv Category Management Services

WANT TO LEARN MORE ABOUT PLANOGRAMS?

The Anatomy of a Performance-Enhancing Planogram

Planograms allow you to increase sales and profits and meet consumer demand. But what goes into the creation of one? Learn all you need to know in this ebook.


Download The Ebook